


Pervious Pavement Design
 Hydrological Design of Pervious Concrete
Part 1 | Part 2 | Part 3 | Part 4 | Part 5
|
Abstract
Pervious concrete can be an important part of context-sensitive construction and low-impact development (LID), used to improve water quality by capturing the “first flush” of surface runoff, reducing temperature rise in receiving waters, increasing base flow, and reducing flooding potential by creating short term storage detention of rainfall. In order to fully utilize these benefits, the hydrological behavior of the pervious concrete system must be assessed. The hydrological performance is usually a key parameter in decisions to use this material as a best management practice (BMP) for storm water management. This publication provides an overview of design techniques for determining hydrological performance and provides an example spreadsheet for analysis. The critical inter-relationships between precipitation potential, pervious concrete system characteristics and site geometry are considered. This publication is intended to assist:
Civil engineers, landscape architects, and other design professionals in the design of an appropriate pervious concrete pavement system, including providing notes on limitations and additional resources.
Permit-granting agencies in the review and acceptance of proposed pervious concrete pavement systems with either active or passive mitigation strategies.
Developers and owners interested in a more complete technical understanding of pervious concrete pavement systems.
Keywords
Best Management Practice, Hydrologic design, Pervious concrete, Storm water control (stormwater)
List of Acronyms and Abbreviations
AMC: Antecedent Moisture Condition of Soil
ASCE: American Society of Civil Engineers
BMP: Best Management Practice
BOD: Biological Oxygen Demand
C: Runoff Coefficient, used in the Rational Method of Estimating Peak Runoff
CN: Curve Number, used in the NRCS Method of Estimating Total Runoff
COD: Chemical Oxygen Demand
EPA: Environmental Protection Agency
HSG: Hydrologic Soil Group
IDF: Intensity-Duration-Frequency
LEED®: Leadership in Energy and Environmental Design, a program to promote and evaluate project designs based on environmental factors; developed by the US Green Building Council
LID: Low Impact Development
NOAA: National Oceanic and Atmospheric Administration
NRCS: Natural Resources Conservation Service, a federal agency; previously named the Soil Conservation Service
NRMCA: National Ready Mixed Concrete Association
PCA: Portland Cement Association
SCS: Soil Conservation Service
STORM: Storage, Treatment, Overflow Runoff Model
SWMM: Storm Water Management Model
TR-55: Technical Report No. 55, a design methodology for estimating total and peak runoff, developed and published by SCS (now NRCS)
USACE: US Army Corps of Engineers
References
ACI Committee 522, Pervious Concrete, 522R-06, American Concrete Institute, Farmington Hills, Michigan, 2006, 25 pages.
ASCE Manual of Engineering Practice, No. 28, American Society of Civil Engineers, 1949, 184 pages.
Bäckström, M., “Ground Temperature in Porous Pavement during Freezing and Thawing,” Journal of Transportation Engineering, Volume 126, Number 5, September/October 2000, pages 375 to 381.
Brakensiek, D.L., and Rawls, W.J., “Green-Ampt Infiltration Model Parameters for Hydrologic Classification of Soils,” in J. Borrelli, V.R. Hasfurther, and R.D. Burman (eds.), Advances in Irrigation and Drainage Surviving External Pressures. Proceedings of an American Society of Civil Engineers Specialty Conference, New York, 1983, pages 226 to 233.
Brown, H.J., Previously unpublished data, 2006. Based on information available at: http://hdsc.nws.noaa.gov/hdsc/pfds/index.html.
Ferguson, B.K., Introduction to Stormwater: Concept, Purpose, Design, Wiley, New York, 1998, 272 pages.
Ferguson, Bruce K., Stormwater Infiltration, Lewis Publishers, Boca Raton, Florida, Wiley & Sons, 1994, 269 pages.
Haselbach, L.; Valavala, S.; and Montes, F., “Permeability Predictions for Sand Clogged Portland Cement Pervious Concrete Pavement Systems,” accepted Elsevier Journal of Environmental Management, 2006.
Horton, R.E., Surface Runoff Phenomenon: Part I, Analysis of the Hydrograph, Horton Hydrology Laboratory Publication 101, Edwards Brothers, Ann Arbor, Michigan, 1935.
Kirpich, P.Z., “Time of Concentration for Small Agricultural Watersheds,” Civil Engineering, ASCE, Volume 10, Number 6, June 1940, page 362.
Malcom, H.R., Hydrology and Urban Water Systems, North Carolina State University, Raleigh, North Carolina, 1986.
Malcom, H.R., Hydrologic Design Principles Using Pervious Concrete, Final Report to Unicon Concrete (now Ready Mixed Concrete), Raleigh, North Carolina, 2002.
Mississippi Concrete Industries Association (MCIA), Pervious Concrete: The Pavement That Drinks, 2002.
Miller, D.A., and White, R.A., “A Conterminous United States Multilayer Soil Characteristics Dataset for Regional Climate and Hydrology Modeling,” Earth Interactions, Volume 2, No. 2, January 1998, pages 1 to 26.
NOAA Atlas 14, Volume 2, Version 2, Ohio River Basin And Surrounding States, U.S. Department of Commerce, National Oceanic and Atmospheric Administration, National Weather Service, Office of Hydrologic Development, Hydrometeorological Studies Center, August 2004. More information is available at: http://hdsc.nws.noaa.gov/hdsc/pfds/. Accessed July 2007.
PCA, Pervious Concrete: Hydrological Design and Resources, CD063, CD-ROM, Portland Cement Association, Skokie, Illinois, 2007.
PCA, “The Pavement that Drinks. Can it Handle the Freeze?,” Concrete Technology E-Newsletter, CTEC 2006 No.3, Portland Cement Association, June 2006, http://www.cement.org/tech/Pervious_print.html.
Rossman, L., Storm Water Management Model, Users, Manual, Version 5.0, EPA/600/R-05/040, US Environmental Protection Agency, National Risk Management Research Laboratory, Office of Research and Development, Cincinnati, Ohio, October 2005, 249 pages.
SCS, Urban Hydrology for Small Watersheds, 2nd ed., 210-VRTR-55, Technical Release 55, Conservation Engineering Division, Natural Resources Conservation Service, US Department of Agriculture, June, 1986, 160 pages.
Tennis, P.D.; Leming, M.L.; and Akers, D.J., Pervious Concrete Pavements, EB302, Portland Cement Association, Skokie, Illinois, 2004, 36 pages.
Terstriep, Michael L., and Stall, John B., The Illinois Urban Drainage Area Simulator, ILLUDAS, Illinois State Water Survey, Champaign, Illinois, 1974, 90 pages.
Tholin, A.L., and Kiefer, C.J., “The Hydrology of Urban Runoff,” Proceedings ASCE Journal of Sanitary Engineering Division, Vol. 84 (SA2), No. 56, Mar, 1959.
Tholin, A.L., and Kiefer, C.J., “Hydrology of Urban Runoff,” Transactions of the American Society of Civil Engineers, Vol. 125, November 1960, pages 1308 to 1379.
US ACE, Storage, Treatment, Overflow, Runoff Model, User's Manual, (STORM), CPD-7, US Army Corps of Engineers, Institute for Water Resources, Hydrologic Engineering Center, Davis, California, August 1977, 176 pages.
US EPA, Preliminary Data Summary of Urban Storm Water Best Management Practices, EPA-821 -R-99-01 2, US Environmental Protection Agency, Office of Water, Washington, D.C., August 1999.
US EPA, Heat Island Effect, US Environmental Protection Agency.
US EPA, Low Impact Development, US Environmental Protection Agency.
US Green Building Council, LEED-NC, Green Building Rating System for New Construction and Major Renovation, www.usgbc.org, Version 2.2, October, 2005, pages 20 to 21.
Viessmann, W., and Lewis, G.L., Introduction to Hydrology, 5th Edition, Prentice Hall, 2003, 612 pages.
Wright-McLaughlin Engineers, Urban Storm Drainage Criteria Manual, Denver Region Council of Governments, Denver, Colorado, 1969.
Wurbs, Ralph A., and James, Wesley P., Water Resources Engineering, Prentice Hall, 2001, 828 pages.
Appendix A
Curve Numbers
The Curve Number of a site with a variety of different surface covers can be estimated as a composite of Curve Numbers of smaller sections of the site, weighted by area. For example, the composite, or weighted CN of an urbanized site overlying an HSG C soil horizon with an R-4 residential area occupying 60% of the total area, a maintained greenway occupying 20%, and a commercially developed area (with 85% impervious surface) occupying the remaining 20% is 83 [(0.60) 83 + (0.20) 74 + (0.20) 94 =83 (not 83.4; the estimate is not that accurate)]. The CN of an agricultural area in an HSG C soil horizon area composed of 40% wooded lot and 60% meadow would be 71 [(0.40) 72 + (0.60) 71]. In urbanized areas, a further adjustment of the composite CN is possible if desired and if the percent of connected impervious area is known, using the methods provided in TR-55 (SCS 1986).
|
||||||||||||||||||||||||||||||||||||||||||||||||||||||||||||||||||||||||||||||||||||||||||||||||||||||||||||||||||||||||||||||||||||||||||||||||||||||||||||||||||||||||||||||||||||||||||
Appendix D
Initial Estimates
|
||||||||||||||||||||||||||||||||||||||||||||||||||||||||||||||||
1 The entries in this table are provided for general information only. All designs must be verified by a registered professional to ensure acceptable performance in the design storm and with the traffic type and volume anticipated.
2 See Table D3 (below) for explanation.
3 Base course guidelines:
Possible indicates that a base course can be used, but often is not included;
Typical indicates that a pervious concrete pavement system will generally require a base course in these types of applications;
Required indicates that a pervious concrete pavement system will almost always need to include a base course in these types of applications.
Base course guidelines:
ABC: Aggregate Base Course; design porosity = 20%; permeability may need to be checked.
CS: Clean Stone ¾ in. to 1 in. NMSA; design porosity = 40%.
4 Porosity of pervious concrete (design): Low < 12%; Moderate = 12% to 18%; High > 25%.
5 Designer will often specify low porosity pervious pavement, 8 in. (200 mm) depth or greater, depending on anticipated axle loads and frequency; depending on the specific soil types, this application may not be optimal.
6 Geotextile guidelines:
Possible indicates often not required (with sandy soil and a CS base, a specifically designed transition sand bed or “filter” may be needed);
Likely indicates will often be needed;
Yes indicates almost always required in these types of applications.
7 Varies depending on the soil characteristics; it may also be possible to use a designed sand filter.
8 Full design by registered professional required; applications in this type of material are intended primarily for storage to reduce peak outflow; infiltration will be minimal. Means for removal other than infiltration will generally be needed.
|
||||||||||||||||||||||||||||||||||||||||||||||||||||||||||||||||
1 The entries in this table are provided for general information only. All designs must be verified by a registered professional to ensure acceptable performance in the design storm and with the traffic type and volume anticipated.
2 See Table D3 (below) for explanation.
3 Base course guidelines:
Required indicates that a pervious concrete pavement system will almost always need to include a base course in these types of applications.
Clean stone indicates that base course will almost always need to be clean stone (for storage capacity).
Base course guidelines:
ABC: Aggregate Base Course; design porosity = 20%; permeability may need to be checked.
CS: Clean Stone ¾ in. to 1 in. NMSA; design porosity = 40%.
Note: With sandy soil and CS base, a designed transition (“filter”) layer may be needed.
4 Porosity of pervious concrete (design): Low < 12%; Moderate = 12% to 18%; High > 25%.
5 Must be specified by the design professional.
6 Geotextile guidelines:
Possible indicates often not required (with sandy soil and a CS base, a specifically designed transition sand bed or “filter” may be needed);
Likely indicates will often be needed;
Yes indicates almost always required in these types of applications.
7 Varies depending on the soil characteristics; it is also possible to use a designed sand filter.
8 Full design by registered professional required; applications in this type of material are intended primarily for storage to reduce peak outflow; infiltration will be minimal. Means for removal other than infiltration will generally be needed.
|
||||||||||||||||||
Appendix E
Slope Effects
Effects of Slope on the Storage Capacity of the Slab
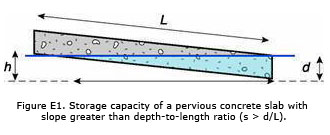
Figure E1. Storage capacity of a pervious concrete slab with slope greater than depth-to-length ratio (s > d/L).
Figure E1 shows the volume that can be filled (Volf, slab) of a pervious concrete slab on a slope greater than d/L. This volume does not include the effects of porosity.
The volume is:
Volf, slab = ½ w d r
Equation E1
where w is width (not shown), d is depth and r is that portion of the length of the slab (L) which holds runoff (w, d, and L all in consistent units).
The slope (s) is defined as h/L. From similar triangles, h/L is approximately equal to d/r (the approximation is good for slopes less than 12%), so, r = d/s (approximately), and Equation E1 can be expressed as:
Volf, slab = ½ w d² / s
Equation E2
The filled volume can be expressed as a percentage of the nominal volume (w d L) by dividing Volf, slab by (w d L), that is, %Vol = ? w d² / (s w d L), or, with simplification:
% Vol = d / (2 s L)
(s > d/L)
Equation E3
where d and L are depth and length of the slab, respectively, in consistent units and s is slope.
Example E1*
Consider a 6-in. (150mm) deep, 100 ft (30.5m) long pervious concrete slab with a 1% slope. The slope (0.01) is greater than d/L ((6 in./12 in./ft) / 100 ft = 0.005), so Equation E3 is applicable:
%Vol = (6 in. / 12 in./ft) / [(2) (0.01) (100 ft)] = 25%.
%Vol = (150mm / 1000mm/m) / [2 (0.01) (30.5m) = 25%
These are slab volumes and must be multiplied by the effective porosity of the pervious concrete to determine the storage capacity.
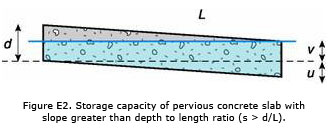
When the slope is less than d/L, a different equation should be used. Figure E2 shows the additional storage found with flatter slopes. In this case:
Volf, slab = 1/2 u w L + v w L (approx.)
The slope (s) is given (approximately) by u/L, and v + u = d. Substituting for u and v leads to:
Volf, slab = [½ s L² + (d - s L) L] w = [½ s L² + d L - s L²] w
Equation E4
which can be simplified to:
Volf, slab = [d L - ½ s L²] w
Equation E5
As above, the filled volume can be expressed as a percentage of the nominal volume (w d L) by dividing Volf, slab by (w d L), or, with simplification,
% Vol = 1 – s L / (2d)
(s < d/L)
Equation E6
where d and L are depth and length of the slab, respectively, in consistent units and s is slope.
Example E2*
Consider a 6-in. (150mm) deep, 100 ft (30.5m) long pervious concrete slab with a 0.25% slope. The slope (0.0025) is less than d/L ((6 in. /12 in./ft) / 100 ft = 0.005), so Equation E6 is applicable. In the other direction, the slab is level and extends 300 ft (91m).
% Vol = 1 - (0.0025) (100 ft) / [(2) (6 in. / 12 in./ft)] = 75%
% Vol = 1 - (0.0025) (30.5m) / [(2) (150mm / 1000mm/m)] = 75%
A pervious concrete slab of these dimensions with an effective porosity of 15% would be able to store 11,250 ft3 (46.8m3) of stormwater. The effective storage capacity is:
(slope effect) (porosity) (nominal volume = w d L)
(0.75) (0.15) (100 ft) (300 ft) (6 in / 12 in/ft) = 11,250 ft3
(0.75) (0.15) (30.5m) (91m) (0.15m) = 46.8 m3
Effects of Slope on the Storage Capacity of the Base Course
The volume of the stone base should be handled separately since it has a different porosity. If the slope is equal to or less than d/L, the entire volume of the stone base will be filled at maximum capacity and no adjustment is necessary.
Volf, base = bavg L w
(s < d/L)
Equation E7
where bavg is the average depth of the base course, and L and w are the length and width of the pervious concrete pavement system, respectively, all in consistent units.
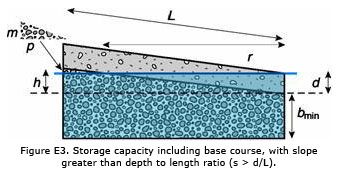
If the slope is greater than d/L, not all of the voids will be filled. Figure E3 shows the effect of a slope greater than d/L on storage of a pervious concrete pavement system including a stone base.
The filled volume of the base course in this case is:
Volf, base = bmin L w + [½ h L - ½ m p] w (approx.)
Equation E8
where bmin is the minimum depth of the base course, m and p are the height and base of the small triangular volume of base cutoff from filling, and h, L and w are as previously defined, all in consistent units.
As noted above, the slope, s, is defined as h/L, so h = s L. In addition, m/p = h/L = s by similar triangles, so m = s p. It is possible to solve for p by noting that p + r is approximately equal to L for slopes less than about 12%, and, with r = d/s, p = L – d/s, or:
½ hL = ½ sL² and ½ m p=½ sp2=½ s(L-d/s)2
Therefore, Volf, base = bmin L w + [½ s L² - ½ s (L - d/s)²] w, or
Volf, base = [(bmin + d) L - d² / 2s] w
(s > d/L)
Equation E9
Example E3*
Consider a 6-in. (150mm) deep, 100 ft (30.5m) long pervious concrete slab with a 1% slope over a base course with a minimum depth of 8 in. (200mm). The slope (0.01) is greater than d/L ((6 in. / 12 in./ft) / 100 ft = 0.005), so Equation E9 is applicable. In the other direction, the slab is level and extends 300 ft (91m). The effective porosity of the slab is 15% and the porosity of the base is 40%.
Volf, base = [(bmin + d) L - d²/2s] w
Volf, base = {(8 in. / 12 in./ft) + (6 in. / 12 in./ft)} (100 ft) - (6 in. / 12 in./ft)² / {(2) (0.01)}] (300 ft) = 31,250 ft3
Volf, base = {(0.20m) + (0.15m)} (30.5m) - (0.15m)² / {(2) (0.01)}] (91m) = 869 m3
In this case, the maximum depth of base course would be 20 in. (508mm) (the minimum base course depth plus s L). The nominal capacity of the base (bavg w L) is 35,000 ft3 (990m3) so the effective capacity of the base course is 89% of the nominal capacity.
The total capacity of this pervious concrete pavement system is the sum of the capacities of the slab and the base. The percent volume of the slab was determined to be 25% (see Example E1). The effective capacity of the slab (15% porosity) is therefore:
(0.25)(0.15)(100 ft)(300 ft)(6 in/12 in/ft) = 280 ft3.
(0.25)(0.15)(30.5 m)(91 m)(0.15 m) = 15.6 m3.
The effective capacity of the base course (40% porosity) is:
(0.40) (31,250 ft3) = 12,500 ft3. (0.40) (869 m3) = 348 m3.
This pervious concrete pavement system can hold approximately 12,780 ft3 (348 m3) of runoff.
The effects of slope can be accounted for in the CN method analysis by multiplying the design depth by the percentage of storage capacity determined using the equations given in this appendix. For example, if the effective porosity of the base course was determined to be 89% and the design depth was selected to be 8 in. (200 mm), the value used in the analysis would be 7.1 in. (178 mm). A separate adjustment would be needed for the pervious concrete slab.