


Pervious Pavement Design
Hydrological Design of Pervious Concrete
Design | Hydrological | Structural
Part 1 | Part 2 | Part 3 | Part 4 | Part 5
A properly designed pervious concrete pavement system can reduce the environmental impact often associated with development. Pervious concrete pavement systems can also be used to improve the environmental performance of existing sites without compromising the business value of a property by replacing existing conventional pavements. The capability to simultaneously maintain water quality, reduce flooding, increase base flow, and preserve valuable parking areas for the property owner, especially in retrofit applications, are capabilities not easily obtained with other water quality or flood mitigation alternatives. Pervious concrete also provides a unique leadership opportunity for stewardship in context-sensitive construction and Low-Impact Development (LID).
Provided here is a description of the fundamental hydrologic behavior of pervious concrete pavement systems and a demonstration of the basic design methodologies appropriate for a variety of sites and circumstances. The limitations of these methodologies will also be briefly discussed.
|
Part 2 – Overview of Pervious Concrete Pavement System Applications
2.1 Water Quality and Water Quantity
2.2 Uses and Applications
2.2.1 Detention and Retention Structures
2.2.2 Passive or Active Mitigation Systems
2.3 Effects of Ponds
Part 3 – Hydrological Design Concepts and Issues
3.1 Runoff Characteristics
3.2 Hydrologic Characteristics of the Watershed: Infiltration and Runoff
3.3 Permeability and Storage of the Pervious Concrete Pavement System
3.3.1 Storage Capacity
3.3.2 Effects of Slope
3.3.3 Effective Storage Capacity — Recovery Through Infiltration
3.4 Design Storms
3.4.1 Selection of the Appropriate Return Period
3.4.2 Design Storm Characteristics
3.4.2.1 Duration-Depth-Frequency
3.4.2.2 Intensity-Duration-Frequency
3.5 Water Quality
Part 4– Hydrological Design Methods
4.1 Introduction
4.2 Percent Impervious Surface
4.3 The NRCS Curve Number Method
4.3.1 Curve Number Method — Design Methodology
4.3.2 Curve Number Method — Design Input
4.3.2.1 Curve Number Method — Design Storm
4.3.2.2 Curve Number Method — Definition and Values
4.3.3 Curve Number Method — Design Procedure
4.3.4 Curve Number Method — Output
4.4 The Rational Method
4.4.1 Rational Method — Design Methodology
4.4.2 Rational Method — Design Input and Use
Part 5 – Examples and Discussion
5.1 Example Proposed Development
5.1.1 Development Plan
5.1.2 Site Conditions and Constraints
5.2 Pre- and Post-Development Runoff Without Pervious Concrete
5.3 Preliminary Estimates for Use in the CN Method and Discussion
5.3.1 Initial Estimates of Infiltration Rate
5.3.2 Initial Estimates of the CN of Adjacent Areas
5.4 Results and Discussion of Site Analysis Including Pervious Concrete
5.4.1 Runoff and Equivalent Curve Numbers
5.4.2 Discussion of Findings of Site Analysis
5.4.2.1 Infiltration Effects
5.4.2.1.1 System Recovery Time
5.4.2.1.2 Comments of Performance with Silty Soils
5.4.2.2 Equivalent Curve Number
5.4.3 Other Design Considerations
5.4.3.1 Comments on the Use of Stone Base
5.4.3.2 Alternate Performance Specifications
5.4.3.3 Additional Impervious Surfaces
5.4.3.4 Comments on Using Pervious Concrete Systems in Sandy Regions
5.4.3.5 Calculations for Passive Mitigation Applications
5.4.3.6 Analysis with a High Water Table
5.5 Estimation of Peak Discharge
5.6 Comments on Designing a Robust Solution
5.6.1 Sensitivity Analysis
5.6.2 Discussion of Sensitivity Analysis Results
5.6.3 Recommendations
5.7 Design Factors in Cold Climates
5.7.1 Frost Heave
5.7.2 Storage Capacity in Cold Climates
5.8 Comments on the Rational Method
Part 1
Introduction
Pervious concrete pavement systems can be an important part of context-sensitive construction, and Low-Impact Development (LID), designed to meet a number of goals related to the function of the site and structure. Goals include the owner‘s objectives and society‘s requirements, both of which are site specific. The needs of society are often at least nominally addressed through permitting requirements, including land use restrictions, zoning limitations, and fees, and reflect increasing concerns related to control of surface runoff associated with development. These needs can vary by community, location, and application, and include both flood control and water quality.
Although pervious concrete* has been used in some areas for decades, recent interest in sustainable development or “green” building and recognition of pervious pavements by the US Environmental Protection Agency (EPA) as a best management practice (BMP) for storm water management has heightened interest in its use throughout North America. Its use supports national initiatives such as EPA’s Heat Island Reduction Initiative (USEPA 2007a) and Low Impact Development (USEPA 2007b) and provides a potential for credit in the LEED® (Leadership in Energy and Environmental Design) rating system for sustainable building construction (US Green Building Council 2005). LEED® includes provisions for control of both water quantity and water quality in storm water design.
[*Note: A pervious concrete pavement system is a combination of elements including pervious concrete, usually a base course of clean stone, and may include filter fabric or geotextile, or curbs. Pervious concrete is a material typically produced with a conventional quantity of cementitious material, low water content, little or no sand, a relatively small, uniformly-sized coarse aggregate , and commonly used admixtures and air entraining agents. Pervious concrete generally has a relatively high permeability and high porosity. See Tennis, Leming, and Akers (2004) for more details.]
The hydrological performance of the pervious concrete pavement system is usually the characteristic of most interest to agencies with permit granting authority. In some cases, limits are placed on the percentage of land which may be developed for a given site without the use of specified remedies including structural Best Management Practices (BMPs) such as detention or retention ponds. Alternately, limits on the quantity of runoff after development may be specified. Pervious concrete pavement systems can be an important part of a sustainable site while simultaneously providing access and parking space.
Unlike many other structural BMPs, pervious concrete paving systems can be used effectively and economically to retrofit existing built-up sites to attain desired hydrologic performance. The EPA’s Preliminary Data Summary of Urban Storm Water Best Management Practices (1999) notes that retrofitting to correct or attain specific runoff limits for an existing, built-up site can be extremely expensive. Pervious concrete pavement systems can be the exception to this rule since they can re-use existing parking areas for impoundment purposes. For example, analysis of one potential parking lot the size of a football field indicated that the runoff from a reasonably urbanized, 9-acre (3.6 ha) area over a sandy silt subgrade would be the same as from grassy pasturage in that area (Malcom, 2002).
Pervious concrete can be a BMP used to mitigate problems associated with surface runoff through several mechanisms. Hydrologically, pervious concrete paving systems can:
1. Capture the “first flush” of runoff from the surface so the pollutant load including trash, “floatables,” and other debris in overland surface runoff and, ultimately, streams and rivers, is reduced, and
2. Create short term storage detention of rainfall which:
a) Reduces the volume of surface runoff,
b) Provides for additional infiltration, thereby recharging groundwater and increasing base flow,
c) Thereby also reducing the velocity of water in both natural and constructed drainage channels, and reduces surface runoff, which can reduce the sediment load carried into receiving waters since both the erosion of channels and the quantity of materials carried into those channels are reduced.
Pervious concrete paving systems also benefit the environment in other ways. The surface temperature of the pervious concrete is lower than, for example, an asphalt pavement, which reduces the “heat island” effect common in built-up areas. The initial runoff from conventional pavements can be much warmer than the receiving water temperature, raising the overall temperature of the receiving water and causing environmental distress. Since runoff is held in the pervious concrete paving system rather than running directly into receiving waters, potential temperature increases in the receiving waters can be significantly reduced.
Pervious concrete pavement systems not only positively impact water quality and water quantity, but can provide other benefits. Pervious concrete can reduce “black ice” formation, reducing potential slipping hazards, as melting snow drains into the pavement rather than ponding on the surface.
The material characteristics of the pervious concrete and other elements of the system significantly affect the final design. The porosity of pervious concrete affects both hydrologically important properties (permeability and storage capacity) and mechanical properties (strength and stiffness). Pervious concrete used in pavement systems must be designed to support the intended traffic load (axle loads and repetitions) and contribute positively to local storm water management strategies. The designer must specify the appropriate material properties, the appropriate pavement thickness, and other needed characteristics, including the absence or presence of features such as base course, filter fabric, or geotextile reinforcement, to meet the hydrological requirements and anticipated traffic loads simultaneously.
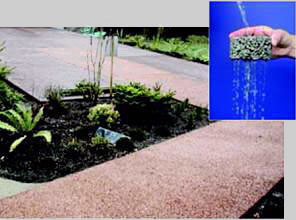
Figure 1. Pervious concrete can reduce surface runoff and recharge groundwater if designed appropriately.
This publication provides an overview and discussion of design techniques which can be used for hydrological design needs, considering the inter-relationship between runoff characteristics, material characteristics, and site geometry. It also provides guidelines for the preliminary selection of appropriate pervious concrete characteristics for specific applications and environments. This publication is intended to assist:
1. Civil engineers, landscape architects, and other designprofessionals-of-record for guidance in the selection and design of an appropriate pervious concrete pavement system, and includes a discussion of design methods;
2. Permit granting agencies in the review and acceptance of proposed pervious concrete pavement systems; and
3. Developers and owners interested in a more complete technical review of pervious concrete pavement systems. A companion publication, Pervious Concrete Pavements (Tennis, Leming, and Akers 2004) provides an introduction to the technology of pervious concrete, including applications, engineering properties, and construction techniques.
Part 2
Overview: Pervious Concrete Pavement System Applications
2.1 Water Quality and Water Quantity
Water quantity issues have traditionally dominated hydrologic design decisions. Efforts to control flooding have often consisted of sizing various structures or elements including culverts, open channels, and storm sewer pipe to ensure adequate capacity. Designs are based on estimating the peak flow at the structure in a given design storm. Water quality has become a much more critical concern in many communities and therefore a more critical factor in many permitting decisions or restrictions. While water quantity controls also positively affect water quality by reducing stream flow velocities, it is important to recognize the paradigm shift in thinking about storm water management. Peak flow is only one aspect of design in improving water quality. The behavior of the entire system must be understood and considered when modeling and making decisions regarding suitability.
2.2 Uses and Applications
2.2.1 Detention and Retention Structures
Conventional stormwater management system BMP’s include impoundment structures, that is, ponds or basins designed to capture stormwater runoff for either retention or detention. A retention pond is designed to hold water for infiltration into the soil. Ponds designed for detention purposes are intended to capture runoff for discharge into natural or manmade channels, or a storm sewer system over an extended time so as to reduce the maximum rate of flow.
Pervious concrete pavement systems are often designed as retention structures. A significant advantage of pervious concrete pavement systems is the ability to park on the “pond,” providing a multi-use facility with many additional advantages. Additional design features outside the scope of this publication are generally required when pervious concrete pavement systems are included as part of a larger detention system and when the overflow discharges into the storm sewer system. Output of the National Resource Conservation Service (NRSC) Curve Number (CN) approach described in this document can be used as input into more complex detention system designs.
2.2.2 Passive or Active Mitigation Systems
In many situations, the use of pervious concrete to simply replace an impervious surface may be considered a sufficient regulatory standard to manage runoff. In other situations, the regulations governing development of a site may require that runoff after development not exceed runoff, or some percentage of runoff, prior to development. In the latter case, the pervious concrete pavement system must be designed specifically to handle much more rainfall than that which will fall on the pavement itself. For example, a parking lot can be used to capture excess runoff from rain falling both on itself and on surrounding areas, including, for instance, the rain collected and discharged through roof drains of nearby buildings. These two applications may be termed passive mitigation and active mitigation, respectively.
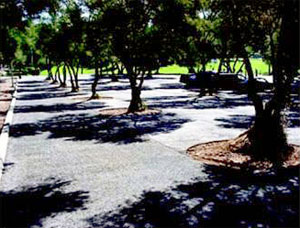
Figure 2. Pervious concrete permits water to sustain trees to infiltrate and may eliminate the need for irrigation.
A “passive” mitigation element is used only to reduce the quantity of impervious surface in a given area by replacing impervious surface with pervious surface. A passive mitigation element might also capture much, if not all, of the “first flush,” providing additional hydrological benefit, but is not intended to accommodate excess runoff from adjacent surfaces.
An “active” mitigation system, on the other hand, is designed to maintain total runoff at some specified level for a particular site with several types of features. Pervious concrete used in an active mitigation system must capture a sizeable portion of the runoff from other areas on site as well as rain falling on its own “footprint.” Typically, such areas include buildings, areas paved with conventional (impervious) pavement (including delivery areas, trash pick up areas, and bus lanes, all of which may carry significant, heavy truck traffic), and traffic islands and buffer zones, which may or may not be vegetated and which may or may not belong to the owner developing the property.
Active mitigation systems are particularly well suited to rehabilitating existing impervious areas for remedial control of urban runoff since they can be designed to capture runoff from adjacent areas. Depending on the size, geometry, and porosity of the pervious concrete system, the excess surface runoff from the site can be kept at or returned to pre-development levels.
Active pervious concrete pavement systems can also be designed as boundary features used in conjunction with conventional pavement to create a locally active, but site-wise passive feature. For example, the pervious concrete system can be designed to capture and temporarily store much, if not all, of the runoff from a conventionally paved parking area by placing a relatively narrow strip of pervious concrete over a deep, clean stone base along the edges of the parking lot. Pervious concrete borders used for tree wells or vegetated traffic islands can be designed as active elements, helping maintain the net runoff from the entire parking area at desired or permit constrained levels. An important benefit of pervious concrete pavement systems with vegetated islands or tree wells is that adequate moisture may be available with minimal, if any, need for irrigation. This is particularly important when working with minimum tree density requirements or when protecting large, existing trees on the site.
The active mitigation design approach is very flexible and can be used for a variety of applications. Primary applications of pervious concrete in an active mitigation role therefore include commercial parking lots, boundary features of commercial development sites, and containment features designed to intercept at least a portion of overland surface runoff prior to entering drainage channels.
2.3 Effects of Ponds
It is important to consider other, often unintended, effects of various design alternates and BMP's in order to make an informed decision. There are a number of significant consequences of retention or detention ponds which may not be obvious at first. Pervious concrete pavement systems may not be the lowest initial cost option and may only be economically feasible in comparison with other alternatives. In new, or “greenfield” construction, specifications can prohibit runoff in excess of that which would occur prior to development, effectively prohibiting development unless mitigation features are provided. Expansion or changes in ownership or use of existing facilities can trigger regulatory constraints and may limit the usable land area by requiring the installation of an arbitrarily pre-selected alternative, such as a detention or retention pond.
Storm water control devices such as detention and retention ponds in a built up area create a significant maintenance and management expense. Fences are often required around such features to limit liability to the owner by controlling access by the public, especially children looking to play in an “attractive,” but potentially dangerous site. Danger can come from physical injury, drowning, or exposure to certain wildlife, including vermin and disease vectors such as mosquitoes, which must be expected in these areas. All of the maintenance and liability exposure must be handled by the owner in a legally responsible and environmentally acceptable manner. While moving soil is not particularly expensive, the loss of the effective use of the land for the pond and the immediate surrounding area, along with maintenance and safety costs can be very high, making pervious concrete economically advantageous. Pervious concrete pavement systems provide a significant and unique value by simultaneously improving water quality, helping to mitigate flooding, and returning the surface area to commercially productive use.
Part 3
Hydrological Design Concepts and Issues
Hydrological analysis can be a complex process and a detailed review is beyond the scope of this report. Ferguson (1994) and Viessmann and Lewis (2003) provide additional information on hydrology and stormwater management. An overview of the characteristics of primary interest in the design of pervious concrete pavement systems, including a brief discussion of the terminology and analytical tools commonly used in hydrology, is provided for several reasons. Not only must the effect of a pervious concrete pavement system on runoff be assessed quantitatively, but the solution must address the needs of key decision makers, using the terminology, values, units and methodologies with which they are familiar. Many key decision makers represent permit granting agencies and often have a technical background in environmental or water quality and quantity issues.
Complete hydrological analysis, when required, must be conducted by a registered professional engineer (PE) or other design professional. In many practical cases, however, detailed analysis may not be required. Tables D1 and D2 in Appendix D show typical characteristics of pervious concrete pavement systems for various situations.
3.1 Runoff Characteristics
An important factor in site development is often the amount of excess surface runoff that can be tolerated for a specific site, area, or watershed. Estimating the volume and rate of runoff is a key part of the hydrologic design. Excess surface runoff is the amount of rain which falls less that amount intercepted by ground cover, that held in depression storage (the small to moderate sized “birdbaths” and “mud puddles” which occur with all surfaces), or that which infiltrates into the soil. Excess storm water runoff will occur with virtually all natural groundcover for any rainfall event of practical interest. With impervious surfaces runoff accumulates more rapidly and more pollutants can wash into streams than with vegetated surfaces.
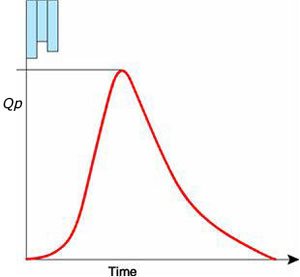
Figure 3. Typical Hydrograph (Qp is the peak discharge rate).
Once precipitation begins, rain will build up in excess of that caught on vegetation or in small depressions and begin to flow overland in sheets. The overland flow quickly becomes channelized and the flow will continue into streams and creeks, then downstream into rivers and larger bodies of water. As runoff from the more distant part of the watershed area accumulates, the quantity and speed of the water in the channel increases. After the rain ends, the runoff subsides. A graph, the runoff hydrograph, which shows the rate of runoff over time at some particular point of interest such as a culvert location, has the typical shape shown in Figure 3. The rain itself may be shown as “falling” from the top of the graph. The peak discharge of the hydrograph is shown in Figure 3 as Qp, normally in cubic feet per second in US customary units, or cubic meters per second in metric units. The volume of runoff is the area under the curve, often converted to acre-ft or m3.
Urbanization results in a shift of the runoff hydrograph as shown in Figure 4, due to the increase in impervious surface which promotes faster runoff and more rapid accumulation. The peak flow of the hydrograph not only increases but occurs sooner. In addition, the area under the curve increases; that is, there is more runoff, since there is less infiltration than with impervious surfaces. Structural BMPs such as detention or retention ponds are intended to reduce the peak runoff by holding some portion of the runoff for some period of time; infiltration of some part of the runoff into the soil may also occur.
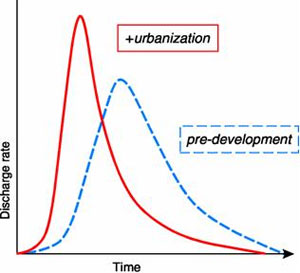
Figure 4. Typical change in runoff due to urbanization.
A common goal of hydrologic analysis of smaller watersheds, such as residential developments or a shopping center, is the design of an “outlet structure,” such as a channel (swale), storm sewer, or culvert, to carry the excess runoff in a particular rainfall event (design storm) without flooding. The design of the outlet structure is often based on the peak discharge the structure is intended to handle. The design of retention or detention structures, such as pervious concrete pavement systems or ponds, however, is based on the volume which must be captured. Both types of design require determination of the hydrologic characteristics of the watershed, selection of an appropriate design storm, and application of the appropriate design method.
3.2 Hydrologic Characteristics of the Watershed: Infiltration and Runoff
Two important hydrologic characteristics of a watershed are the amount of runoff which can be anticipated from different areas and the amount of infiltration, that is, the amount of precipitation which will soak into the soil for some given rainfall. Both factors are related to the soil type. A sandy soil will tend to have more infiltration and less runoff. An area with a tight clay will tend to have less infiltration and more runoff.
Runoff is also affected by the slope of the land and the type and extent of vegetation. Estimation of runoff characteristics relies heavily on empirical data and methods. The values used vary with the design method and have been published, but the specific values used in the design of a specific site can vary significantly between different, experienced practitioners. Ferguson (1994) provides a detailed and informative discussion of infiltration. Selection of values is discussed in more detail in Part 4.
The infiltration rate of a soil will vary with the amount of moisture already in the soil, the antecedent moisture condition (AMC). Using the steady state infiltration rate (see Figure 5) is reasonable and conservative for pervious concrete pavement systems. The rate is approximately constant within about an hour for the types of soils where infiltration is an important part of the design.
Using the steady state value makes the design less sensitive to assumptions regarding prior rainfall and AMC. This approach also means that performance in service will often exceed design characteristics. Values of typical infiltration rates are published in several sources, but professional judgment is required in selecting an appropriate value for hydrologic design of pervious concrete pavement systems.
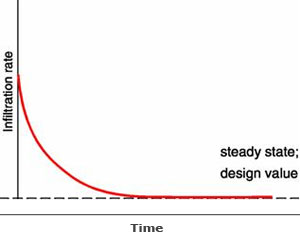
Figure 5. Typical rate of infiltration over time of an initially dry soil (after Horton 1935, and Tholin and Kiefer, 1959).
Soil type is one of the most important factors affecting the rate of infiltration. Soils can be classified for hydrologic purposes as HSG (Hydrologic Soil Group) A (sand, loamy sand, or sandy loam), HSG B (silt loam or loam), HSG C (sandy clay loam), or HSG D (clay loam, silty clay loam, sandy clay, silty clay, or clay). The soil horizon with the highest infiltration capacity is HSG A; the infiltration rate is lowest for HSG D. The location of the water table can also affect infiltration significantly. A high water table will impede infiltration, even in sand.
|
||||||||||||||||||
|
||||||||||
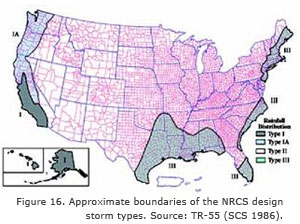
Various estimates of the infiltration rate for different soil horizons have been developed (see Figure 6, for example). Table 1A shows values given in TR-55 (SCS 1986). The values in Table 1B are derived from ASCE Manual of Engineering Practice (American Society of Civil Engineers 1949), summarized by Viessmann and Lewis (2003). The values in both tables are very similar.
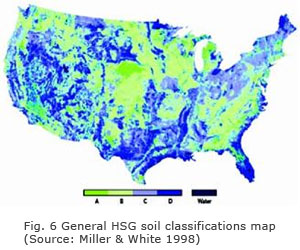
Guidance on the selection of an appropriate infiltration rate to use in design is provided in texts, Natural Resources Conservation Service (NRCS, previously the Soil Conservation Service, SCS) soil surveys, and ASCE guidelines. The designer must consider, however, several limitations when selecting infiltration values from published data (Malcom 2002). First, NRCS values are for natural soils which, even for a specific soil type, can vary significantly. Further, the infiltration rate of natural soils decline with depth, so the published data from NRCS are, at best, average values over large, minimally disturbed, surface areas. In addition, moving soil during construction often, in effect, turns the natural soil “upside down.” This soil is then re-compacted prior to construction. Considering these factors, and the values in Table 1B (ASCE), initial estimates can be established as indicated in Table 2.
These values are appropriate for preliminary designs and feasibility studies, but may need to be adjusted based on site investigation. In many cases they are sufficiently accurate for permit application review, to make decisions on the technical viability of a proposed pervious concrete paving system (Malcom 2002), and can be used in final designs if the system is sufficiently robust.
The design of pervious concrete paving systems in soils with substantial silt and clay content or a high water table should be approached with some caution. It is important to recall that runoff is relatively high in areas with clayey soils or clayey-silts, even with natural ground cover, and properly designed and constructed pervious concrete pavement systems can provide a positive benefit in many situations. In very tight, poorly draining soils, lower infiltration rates can be used for feasibility studies, but the “drawdown” time, that is, the time needed for captured runoff to drain out of the pervious concrete pavement system through infiltration of the soil subgrade, may limit some applications. This topic is discussed in more detail in Part 5.
Pervious concrete pavement systems may be used for active mitigation even with very tight, non draining soils when designing the system as a detention rather than retention device, although additional structural details must be provided. In these situations, since the soil will take in very little runoff anyway, regardless of the cover, the intent is to simply reduce the peak flow by holding the runoff for some period of time. Infiltration is not considered a critical feature of the design since virtually all of the captured runoff will be released directly into natural channels or the storm sewer system. With the inclusion of additional subsurface storage devices the peak flow can be reduced significantly. This approach may be required when riparian rights are an issue.
|
||||||||||
In areas where the clay layer is relatively thin and close to the surface, it may also be possible to provide water flow through an impervious soil layer into underlying permeable strata by drilling through any impervious layers and installing a well. The well shaft should be lined with a geotextile filter fabric and filled with stone. These wells, sometimes referred to as injection wells, connect the pervious concrete to the pervious strata. Additional analysis with additional elements are typically required in these situations, especially if the water table is close to the surface, and may require the services of a geotechnical engineer as well as a hydrologist. These features are likely to be economically viable only where permeable strata exist at reasonable depths.
3.3 Permeability and Storage of the Pervious Pavement System
Design of pervious concrete pavement systems must consider two possible conditions. Surface runoff in excess of the desired quantity must not occur in the design rainfall event due to:
1. Low permeability of the pervious concrete, or
2. Inadequate storage provided in the pervious concrete system.
Permeability is, in general, not a limiting or critical design feature. The permeability of the pervious concrete and any underlying base course will be much higher than the steady state infiltration rate of almost all soils as long as the pavement surface is adequately maintained. A moderate-porosity pervious concrete pavement system will typically have a permeability of 3.5 gal/ft2/min (143 L/m2/min), which is equivalent to an infiltration rate in excess of 340 in./h (8600 mm/h),* more than 100 times the infiltration rates of most natural, saturated sands. The exfiltration rate of captured runoff from the pervious concrete pavement system into the underlying subgrade is controlled by the soil infiltration. Permeability of the pervious concrete pavement should be retained by routine maintenance in service, which may consist of periodic (annual or semi-annual, for example) vacuuming.
[*Note: Since hydrological engineers and technical personnel at many permitting agencies are more familiar with the types of units discussed above, the designer of a pervious concrete pavement system may elect to use these types of units to ensure good communication. To convert from inches of rainfall per hour to the typically used units of gallons per square foot per minute for the passage of water (permeability) through pervious concrete, the designer may multiply the value in in./h by 0.0104 to obtain the required flow in gal / ft 2 / min. A simpler conversion factor of 0.01 can be used for almost any practical purpose since the input values are rarely known with enough precision to justify a more accurate conversion factor (In metric units, to convert from mm/h to units of L / m2 / min, divide by 60).]
3.3.1 Storage Capacity
The total storage capacity of the pervious concrete pavement system includes the capacity of the pervious concrete pavement, plus that of any base course used, and may be increased with optional storage features such as curbs or underground tanks. The amount of runoff captured should also include the amount of water which leaves the system by infiltration into the underlying soil. All of the voids in the pervious concrete will not be filled in service because some may be disconnected, some may be difficult to fill, and air may be difficult to expel from others. It is more appropriate to discuss effective porosity, that portion of the pervious concrete which can be readily filled in service.
If the pervious concrete has 15% effective porosity, then every inch (25 mm) of pavement depth can hold 0.15 in. (3.8 mm) of rain. Thus, a pervious concrete pavement 4 in. (100 mm) thick with 15% effective porosity can hold up to 0.6 in. (15 mm) of rain.
An important source of storage is the base course. Compacted, clean stone (#67 stone, for example) used as a base course has a design porosity of about 40%; a conventional aggregate base course, with a higher fines content, will have a lower porosity (on the order of 20%). From the example above, if 4 in. (100 mm) of pervious concrete with 15% porosity were placed on 6 in. (150 mm) of clean stone, the nominal storage capacity would be 3.0 in. (75 mm) of rain:
Pavement |
+ |
Base |
= |
Total |
(15%) 4 in. |
+ |
(40%) 6 in. |
= |
3.0 in. |
(15%) 100mm |
+ |
(40%) 150 mm |
= |
75mm |
The effect of the base course on the storage capacity of the pervious concrete pavement system is significant.
A third potential source of storage is available with curbed pavement systems. Where curbs are provided for traffic control, edge-load carrying capacity, or safety, and the accumulation of standing water is permitted, the depth of water impounded by the curb will also provide storage capacity. A design incorporating ponded water up to the depth of the curbs is not normally included at mercantile establishments or other areas anticipating significant foot traffic or public exposure during an intense storm. This feature may be included, however, in applications such as low-use or low-traffic parking areas, particularly with well draining soils where the impoundment will be brief. This feature would also not normally be used if an extended impoundment time is anticipated in an area which is also subject to freezing.
When used, a curb provides essentially 100% porosity, so the height of the curb adds directly to the storage capacity of the pavement system (see Figure 7) in a flat area. To continue the example above, the total storage capacity of the pavement including 4-in. high curbs will be 7 in. (175 mm):
Pavement |
+ |
Base |
+ |
Curb |
= |
Total |
(15%) 4 in. |
+ |
(40%) 6 in. |
+ |
(100%) 4 in. |
= |
7.0 in. |
(15%) 100mm |
+ |
(40%) 150 mm |
+ |
(100%) 100 mm |
= |
175mm |
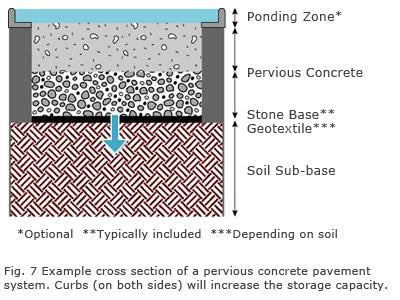
Additional storage capacity can also be obtained by adding underground storage devices or tanks. These “cistern” type applications are often used to store water for purposes other than simple runoff control.
3.3.2 Effects of Slope
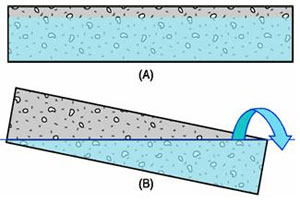
Figure 8. A smaller proportion of the pervious concrete system's storage capacity can be used for slabs that are not level.
A critical assumption so far is that the entire system is level. If the slab is not level, and the rainfall intensity is greater than the infiltration rate of the soil, the upper portion of the slab will not be filled and the rainfall will quickly run to the lowest part of the slab (see Figure 8). Once the lower part is filled, the rain will run out of the lower end of the pavement rapidly due to the high permeability of the pervious concrete, limiting the beneficial effects of the pervious concrete.
The effective volume, expressed as a percent of the nominal volume of a pervious concrete pavement with a slope greater than d/L, can be shown to be:
% Vol = d / (2 s L) Equation 1*
where d and L are the width and length of the slab (respectively, in consistent units), and s is the slope (Equation 1 is valid only with s> d/L).
[*Note: Equation 1 is not exact unless the length of the slab is the map length rather than the surface length. The error is negligible, however, unless the slope exceeds 12%. Equation 1 is not applicable for slopes less than d/L; see Appendix E for additional information.]
For example, for a 6 in. (150 mm) deep, 100 ft (30.5 m) long slab with a 1% slope, the % Vol is only 25% of the nominal volume of the pervious concrete without considering the effects of a base course.
% Vol = (6 in. / 12 in./ft) / [(2) (0.01) (100 ft)] = 25%.
% Vol = (150 mm / 1000 mm/m) / [2 (0.01) (30.5 m) = 25%.
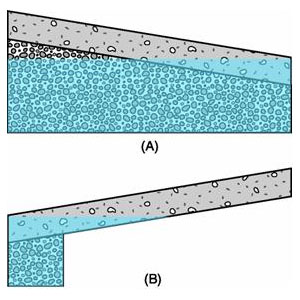
Figure 9. A recharge bed (A) or a well (B) may be necessary for sloped pavements.
These reductions in useable volume can be significant and indicate two important features in the design of pervious concrete pavement systems. Pervious pavements should not be constructed with crowns and should be as level as possible. When the pervious concrete pavement is not level, and the anticipated rainfall rate exceeds the infiltration rate, which is the case for all soils except deep, very clean sands, the depth of the pervious system must be increased to meet the desired runoff goals. It is often the base course thickness that is increased due to economic considerations.
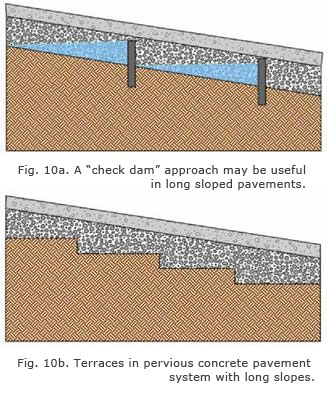
The needed storage capacity can also be provided by a relatively deep recharge bed of clean stone located beneath the downstream end of the pavement. The effects of non-uniform saturation on axle-load carrying capacity of the pavement must be considered with this type of structure, however. When a slope is unavoidable and a highly localized recharge bed or well is used (see Figure 9), the design implications of the recharge bed on site hydrology must be closely examined by the designer of record. For pervious concrete pavement systems which are very long, it may be necessary to use terracing or include intermittent “check dams” to increase the storage volume (see Figures 10a and 10b).
3.3.3 Effective Storage Capacity — Recovery Through Infiltration
Soil infiltration can significantly affect the amount of useful storage in a pervious concrete pavement system over time. The net storage capacity of the pavement system is dynamic.
The amount of runoff held at any one time is a function of the storage capacity of the pervious pavement and base course (based on porosity and geometry), the runoff entering the pavement system (both rain falling on the pervious concrete and runoff from adjacent surfaces), and runoff accumulated from previous rain during the storm, less infiltration into the soil (the “exfiltration” from the pavement system). Soil infiltration drains the system so as to restore some part of the storage capacity during the storm and to remove the rainfall captured by the system after the storm. A hydrologic model developed to predict the behavior of a pervious concrete pavement system should include both the effects of runoff accumulation and the positive benefits of infiltration on recovery of storage capacity during the storm.
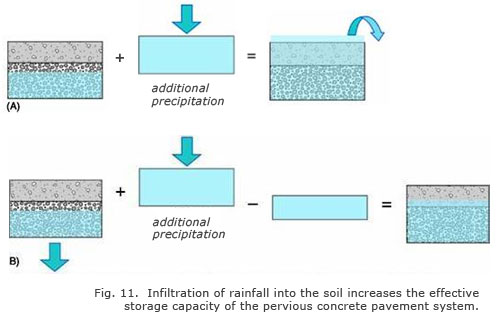
An example can demonstrate system behavior (see Figure 11). As shown above, a 6-in. (150-mm) thick pervious concrete pavement with 15% porosity can hold about 0.9 in. (23 mm) of runoff. Assume that the pervious concrete has accumulated 0.2 in. (5 mm) of rain and that, during the next hour, an additional 0.8 in. (20 mm) of runoff will flow into the pavement. This would lead to 0.1 in. (2.5 mm) of runoff flowing off of the pervious concrete if no infiltration were to occur (Figure 11A). If the pervious concrete was placed on a loamy sand with an infiltration of 0.5 in. (13 mm) per hour, a net inflow of only 0.3 in. (7 mm) would occur (0.8 in. (20 mm) inflow minus 0.5 in. (13 mm) outflow). Instead of 0.1 in. (3 mm) of runoff from the system, the pervious concrete would have a net positive storage capacity of 0.4 in. (10 mm) remaining (the total capacity of 0.9 in. (23 mm) less the sum of the 0.2 in. (5 mm) already accumulated and the net 0.3 in. (8 mm) inflow) (Figure 11B).
Evaporation of stormwater in the pervious concrete pavement system after the storm will also contribute to storage capacity recovery. Estimates of the quantity and rate of evaporation have not been fully established for pervious concrete. Neglecting this effect is both computationally convenient and conservative.
3.4 Design Storms
Runoff is also affected by the nature of the storm itself; clearly a heavier rain results in more runoff. Storms have a distribution, or pattern, of rainfall intensities, often starting and ending with lower intensities, with the maximum intensity often occurring at some point after the storm has begun. Different sizes of storms will result in different amounts of runoff and the selection of an appropriate design storm is important. Larger storms occur less often on average and storms are typically designated based on their return period. For example, a storm which occurs on average once in 20 years is designated a “20-year storm” and will be larger (more rainfall is produced in the same period of time) than a “10-year storm.”
3.4.1 Selection of the Appropriate Return Period
Selection of the appropriate return period is important because it establishes the quantity of rainfall which must be considered in the design. Often, the design storm is chosen by local authorities, such as city or county water boards. Storms of interest in hydrologic design of small watersheds are typically the 2-year storm and the 10-year storm. The 2-year storm is often used as the “service load” storm for the watershed for water quality purposes. The 10-year storm has traditionally been used in the design of storm water collection systems (Veissman and Lewis 2003; Malcom 1986).
One of the primary purposes of pervious concrete paving systems is water quality, so pervious concrete pavement systems are often designed to capture a 2-year storm. When flood control is a major issue, the 10-year storm may be used as the design load for the system. Performance should be checked in both storms. A pervious concrete paving system integrated into a storm water collection system designed for the 10-year storm can easily result in the use of smaller pipes and culverts, resulting in cost savings, especially for new construction (Malcom 2002).
Other storms, such as the 20-year, 50-year, and 100-year storms are generally used when analyzing much larger basins for flood control. Local jurisdictions may also require analysis of smaller system behavior in storms with these longer return periods when restricting post-development peak discharge in new construction. The methodology discussed in Part 5 is also appropriate for use with these larger design storms.
3.4.2 Design Storm Characteristics
3.4.2.1 Duration-Depth-Frequency
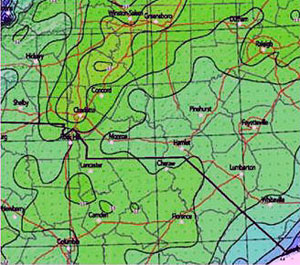
Figure 12. Duration-Depth-Frequency map of 24-h, 2-year precipitation for a portion of the southeastern U.S. Values Numbers on isopluvial maps refer to inches of rainfall.
Map available at: http://hdsc.nws.noaa.gov/hdsc/pfds/ (NOAA 2004).
There are several aspects of precipitation characteristics to consider in the hydrologic design of flood control or water quality features in small watersheds. The total volume of precipitation for a given duration and return period can be estimated based on Duration-Depth-Frequency charts, tables, or maps. Estimates of the maximum rainfall expected in depth (inches or mm) for a given duration (such as the 20-minute, 1-hour, 2-hour, or 24-hour storm) in a given return period (such as 2 years, 10 years, 100 years, etc.) are available for different locations. The National Oceanic and Atmospheric Administration (NOAA) Atlas 14 is currently being updated to replace previous NOAA Atlas maps and estimates (2004). Rainfall estimates for many areas are available online at http://hdsc.nws.noaa.gov/hdsc/pfds/. For example, in one location in the mid-Atlantic region, 3.6 in. (90 mm) of rain is expected to fall in a 24-hour period, once every 2 years, on average. The 24-h rainfall amount is used both for retention or detention structures and in the Curve Number Method described in Part 4.
The 24-h rainfall amount for the return period of interest, such as the 2-year storm, is not distributed uniformly. A typical rainfall will often start out with lighter rainfall, with the heaviest rain occurring sometime after the storm has begun. The distribution, or pattern, of rainfall within the storm varies by location. Areas in the northwestern US, (temperate rainforest regions) will have a different pattern of rainfall than areas more exposed to subtropical storms or “nor’easters.” Specific rainfall distributions or patterns to be used in hydrological design are discussed in more detail in Section 4.4, describing the NRCS design methodology.
3.4.2.2 Intensity-Duration-Frequency
Small watersheds are “sensitive” to (that is, they tend to flood in) short, intense storms. Designs of flood control structures in small watersheds based on the Rational Method use Intensity-Duration-Frequency (IDF) values. In general, the rainfall intensity (the rate of rainfall) will be more intense the shorter the rainfall period. For example, in a 1-hour storm, the rate of rainfall may be 1.5 in./h (about 38 mm/h), while in a 15-minute storm the rate of rainfall in that same location will be higher, perhaps 3.2 in./h (about 80 mm/h).
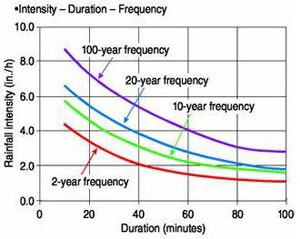
Figure 13. Typical Intensity-Duration-Frequency Chart.
Although the total amount of rain falling in that 15 minute time period would only be about 0.8 in. (about 20 mm), the rainfall could accumulate rapidly enough to cause flooding if the outlet structures could not handle the flow (volume per unit time) of runoff occurring during that relatively short period. The Rational method approach and IDF values are described in more detail in Part 4.
IDF curves or charts are available for many locations. A typical chart is shown in Figure 13. In this chart, the rainfall intensity for a storm with a duration of 20 minutes which occurs once every 10 years on average (20-min, 10-year storm), is about 4.7 in./h (about 12 cm/h).
3.5 Water Quality
Water quality issues for small watersheds have become increasingly important. Pervious concrete paving systems can form an important part of current storm water discharge plans required for Municipal Separate Storm Sewer Systems (MS4) permits by improving water quality, reducing peak discharge and increasing base flow. The EPA’s BMP Summary (US EPA 1999) lists a number of structural BMPs, including: infiltration systems (infiltration basins and porous pavement), detention systems (including basins and underground vaults), retention systems (wet ponds), constructed wetland systems, filtration systems, media filters and bio-retention systems, vegetated systems (such as grass filter strips and vegetated swales), minimizing directly connected impervious surfaces, and miscellaneous and vendor supplied systems (including oil-water separators or hydrodynamic devices).
The primary goals of structural BMPs are to control flow, (i.e. reduce the peak discharge and volume of runoff), and to reduce pollutant loadings (US EPA 1999). While flow control is traditionally related to flood control, it is also strongly related to overall water quality because a reduction in runoff volume means more infiltration and a reduction in peak discharge results in lower stream velocities and erosion. Infiltrating more of the runoff means that rain is returned to the water table and the base flow of streams is maintained at higher levels, improving habitats and maintaining desirable ecosystems.
Another contribution to water quality provided by pervious concrete paving is a reduction in the temperature of stormwater runoff or discharge. Water temperature is an important measure of water quality (EPA 1999) and pervious concrete paving systems not only capture that part of the runoff warmed by flowing over initially hot pavements, but they also can reduce the heat island effect, which is common with asphalt pavements.
Pervious concrete paving systems also capture a portion of the pollutants before they flow into the receiving waters. The source of much of the material washing into streams, rivers, and eventually into ground water, can be classified as either an excess of intentionally applied materials such as fertilizers and nutrients, pesticides, and road salts, or accidentally or casually applied materials such as gasoline and petroleum products from drips, spillage, and tire abrasion, plus other residue such as litter, spills, animal waste, and fine dust. Some of these are quickly picked up and carried by runoff, while others, including relatively insoluble products such as grease and low volatile content oils, may not be. Another source of concern with water quality has been poor stewardship practices such as ineffective or un-enforced control of runoff on bare earth, often from sites under development. Lack of effective controls has resulted in significantly increased sediment loads in some areas.
Often, although not always, the initial storm water runoff will carry a higher concentration of pollutants than runoff that occurs later, after the surface has been washed off by the rain. This part of the runoff with a higher pollutant load is termed the first flush. In more arid areas, with long periods between rains, a seasonal first flush may need to be considered. One of the common goals of mitigation is to capture the first flush of runoff, particularly when dealing with small catchments, or drainage areas. While capturing the first flush of an area is often desirable, the disposal of the first flush and cleaning of the catch basin after removing the first flush so that is does not wind up in rivers and streams can be problematic and expensive.
The first flush may not be observed for several reasons. First, larger areas rarely show a first flush since a steady stream of the first flush of areas farther and farther away from the outlet arrive over time. Part of the difficulty in assessing the first flush is the combination of travel time and dilution effects occurring in larger areas. Second, the first flush may not be apparent if pollutants are not easily washed away or dissolved. Third, differences in pollutant load over time may be difficult to detect if the supply of pollutants is essentially continuous; an example of this situation is the supply of sediment from bare, easily eroded ground.
Adoption of specific types of mitigation devices and features depends on the use of the site, the types and quantities of pollutants anticipated, the estimated runoff, and site characteristics. A lack of sufficient data in many areas, variations from place to place, and seasonal variations have resulted in the use of relatively simple rules of thumb for selecting or approving certain types of mitigation features.
As a crude rule of thumb, the first flush is often considered to occur during the first 30 minutes to one hour for small sites such as parking lots (Veissman and Lewis 2003). If pervious concrete is present, analysis indicates that the first hour of rain will generally be captured. Thus, it is reasonable to assume that, as a minimum, that part of the runoff with the highest pollution load will be captured. Pervious concrete systems can thus provide an effective tool to capture the first flush, including trapping floatables, such as plastic bottles, paper or foam cups, and snack wrappers on the surface where they can be removed during routine maintenance rather than discharged into the storm sewer. These items can significantly detract from the aesthetic effects of receiving waters.
It is believed that pervious concrete pavements will carry the soluble “first flush” pollutants into the pores of the concrete and additional rain will carry the pollutants further into the system, where they will be held until infiltrated, rather than becoming a part of the runoff stream. Compounds contributing to biological oxygen demand (BOD) and chemical oxygen demand (COD) should then undergo natural filtering and purification such that the water reaching the ground water table will be of roughly the same quality as that moving through similar in-situ soils. Greases and low-volatile content oils, such as drips from vehicles, will be typically adsorbed onto the surface of the pervious concrete or, at worst, in the pores of the pervious concrete. This is expected to result in negligible effects on porosity and permeability of the pervious concrete, although this is an area in which additional research is needed.
The effect of the total suspended solids (TSS), including the grit and fines in the runoff, carried into the pervious concrete pavement system have not been fully established and additional research is warranted. Sedimentation in the concrete paving system may result in a slight loss of storage capacity. A simple analysis indicates that storage capacity may be minimally affected, as long as the pervious concrete paving system is protected from wash-off during construction activities, however. The TSS tends to be about 1,000 pounds per acre per year (0.112 kg/m2/year) (USEPA 1999) (Wurbs and James 2002) from commercial areas and less for most other types of urbanized sites except construction. For a 20-acre (80,000-m2) shopping site, a pervious concrete pavement system designed to be an active mitigation structure may occupy 40% of the total area draining into the pavement. The TSS deposited in the pavement will be less than 152 in. (12 mm) in depth in 20 years of service, resulting in only a few percent loss in storage capacity. Clearly, additional storage should be included in any design where sedimentation is expected to be high; an extra inch (25 mm) of aggregate base would supply sufficient storage capacity to more than offset volume losses due to sedimentation in this example.
The effects of sedimentation on permeability may be more significant. The surface of pervious concrete is typically denser than the bulk due primarily to compaction operations during construction; sedimentation of larger particles (sands) may be concentrated at the surface such that flow into the pervious concrete is reduced. Studies (MCIA 2002) have indicated that permeability may be largely restored by routine maintenance operations (Valavala, Haselbach, and Montes 2006).
Rules of thumb concerning sedimentation of conventional ponds are not appropriate and may be misleading since the “footprint” of a pervious concrete paving system is so much larger than that of conventional water quality ponds. It is important to note, however, that construction can contribute significantly higher amounts of sediment and so a pervious concrete paving system must be protected during construction. Additional research on the effects of sedimentation on permeability and porosity would be useful.
Part 4
Hydrological Design Methods
4.1 Introduction
The methodology used in the hydrological design of pervious concrete pavement systems should reflect the level of detail needed to satisfy the agency specifying, permitting, or regulating the use of pervious pavement. The methodology should also be sufficiently rigorous to meet the needs of the design professional, and should reflect the behavior of the system in service within the limits of accuracy needed. Computational efficiency is a desirable, although not compelling, factor, and model complexity may not necessarily improve model accuracy. A model that is simultaneously simple to use and captures the essential elements of behavior is useful and important to the design professional, even when advanced analysis is not required by local regulations.
Site conditions and regional needs can vary significantly. Local regulations can range from simple to complex depending on the needs and characteristics of the area and the objectives of the regulatory agencies. Solutions and approaches suitable for one area may be overly restrictive and prescriptive in another, or provide insufficient protection in a third.
The method recommended in this document is the NRCS (SCS) Method, or “Curve Number” method as outlined in Technical Release 55 (TR-55) (SCS 1986). This method:
Is well established and widely used by many design professionals involved in managing runoff,
Captures the essential elements of pervious concrete pavement system behavior,
Is appropriate for the design of a structure intended to capture and hold some portion of the runoff in a small urban watershed (such as a retention or detention feature),
Is flexible and easily adapted to a site with several types of surfaces contributing to runoff,
Is easily implemented by adapting well known stagestorage-discharge principles to the simple geometry of a pervious pavement system, and
Can be used to analyze systems intended to function within the constraints of many different regulatory requirements.
Users of this document who are unfamiliar with hydrological design methods should be aware that there is no nationally accepted, standard design technique for estimating total runoff; preferred techniques vary with region and application. Techniques favored in the western US are generally those of the Bureau of Reclamation, while those favored in the eastern two thirds of the US are often those of the Natural Resources Conservation Service (NRCS). Results with these methods are similar enough that the techniques presented in this document based on the original NRCS (SCS 1986) methods can be adapted for most applications. Other potential hydrological design methods not reviewed in this document include the Chicago (Tholin's) Hydrograph Method (Tholin and Keifer 1960), the Illinois Urban Drainage Area Simulator (Terstriep and Stall 1974), the U.S. Army Corps of Engineers' Storage, Treatment, Overflow Runoff Model (STORM) (USACE 1977), and the Storm Water Management Model (SWMM) (Rossman 2005), many of which estimate peak flows.
Another common approach, the Rational method, is also discussed for completeness. In the authors' opinions, the Rational method, while acceptable and appropriate in many regions or situations, is not the best methodology to use when analyzing pervious concrete pavement systems. The results must be used with caution and can lead to problems in some situations if used without considering all aspects of the system behavior. These limitations are discussed briefly in Part 5.
Since the design of pervious concrete pavement systems typically involves hydrological design of relatively small watersheds for very specific purposes, and since many of the input data are known or estimated with limited precision, the use of a complex model provides neither additional accuracy nor additional information or insight into the solution, while the computational cost can increase significantly. A relatively simple but flexible model is adequate and appropriate for these applications. The methods described below, especially those in Section 4.4, are suggested since they are well established, easily implemented and are commonly employed in many parts of North America.
The authors have attempted to keep this review relatively simple and still provide sufficient fundamental technical background and discussion to assist in developing a useful pavement structure. Other methods are not reviewed in detail in this document since they are not commonly used, are limited in applicability, or are overly complex and intended for analysis of much larger watersheds (Corps of Engineers methods, for example fall into this later category). Clearly, the design professional experienced with these or other design methods can provide a structure with satisfactory performance. This document is not meant to substitute for the experience and professional judgment needed to fully design a complete system, including both a pervious concrete pavement and overflow structures. It is intended to be used to craft those designs more efficiently and help produce structures that instead simultaneously meet the needs of the site owner, regulatory agencies, and the community.
4.2 Percent Impervious Surface
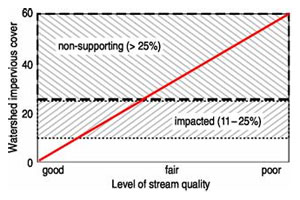
Figure 14. Effect of percent of impervious area on stream quality.
Since the percent of impervious surface in a watershed directly affects the quality of streams in that area and downstream (see Figure 13), a simple, easy to implement land management policy is to limit the amount of impervious surface in the built up area to some specific limit. In some jurisdictions, therefore, regulatory restrictions may limit only the percent of impervious surface in a watershed. In these situations, advanced analysis may not be required; pervious concrete pavement systems should be considered to be pervious areas in determining total impervious area. In other jurisdictions, additional constraints and limitations are placed on allowances of pervious pavement systems in calculating the percent impervious area. In these and many other situations, a more detailed hydrological analysis of the project is required.
4.3 The NRCS Curve Number Method
A common method used in hydrologic analysis and design of smaller watersheds is the Soil Conservation Service (SCS), now the Natural Resources Conservation Service (NRCS) method described in Technical Report 55 (TR-55) (SCS 1986). This method is commonly used in the design of impoundment structures such as detention or retention ponds. It is, in the authors' opinions, the most appropriate approach to use in the design of a pervious concrete pavement structure where the intent of the design professional is to assess the effects of changes in the site on total runoff, that is, where the primary hydrologic purpose of the pervious concrete paving system is to act as an impoundment feature.
The procedure described in this document, based on TR-55 values and methodology, estimates total runoff but the output can also be used to estimate the peak runoff of a site. This approach provides a useful model of overall site behavior and can be used to evaluate the use of pervious concrete pavement systems in a variety of situations. This method, as it is applied to the hydrologic design of pervious concrete pavement systems, will be referred to as the “Curve Number method” in this document.
Like the Rational method, the Curve Number method includes the use of coefficients (the “Curve Numbers”) to estimate runoff based on types of soil and cover conditions. Adjustments to coefficients, based on the amount of impervious surface and how much of that impervious area is connected, are also possible. A major distinction between the two methods is that the Curve Number method utilizes a 24-h design storm, rather than the 15- or 30-minute storm used in the Rational method (see Section 4.4), and so it analyzes the behavior of the system and the site under more realistic conditions. By capturing the behavior of the system throughout a longer storm duration, explicitly including the significant effects of infiltration and long term storage capacity of the pervious concrete pavement system, as well as incorporating the effects of both impervious surfaces and other surfaces with a variety of cover, the Designer is better able to quantify critical performance characteristics of the entire site.
The Curve Number method is often combined with stagestorage-discharge methods to design impoundment features such as retention and detention ponds. While stage-storagedischarge functions can be complex and time consuming to formulate in general, the simple geometry and discharge characteristics of flat pervious concrete pavement systems make the TR-55 (SCS 1986) Tabular Hydrograph Method easy to adapt to spreadsheet analysis, and easy to use in practice. Therefore the Curve Number method can provide a realistic, robust, and easily implemented model of the hydrologic characteristics of a site while incorporating the effects of pervious, impervious and other surfaces with a variety of cover, to estimate the total runoff and the total volume of rainfall captured and infiltrated.
4.3.1 Curve Number Method — Design Methodology
The Curve Number method estimates the total volume of runoff, Q* (inches) using Equations 4 and 5 below. The runoff volume is designated “Q” in the literature, but the “Q*” designation is adopted in this document to distinguish it from the peak flow (ft3/s) Q estimated by the Rational method.
Q* = (P - 0.2 S)2 / (P + 0.8S) Equation 4
where
Q* is the total volume of runoff (inches),
P is the precipitation (inches),
S is the area (basin) retention (inches), where
S = 1,000 / CN – 10; Equation 5
and CN is the (composite) Curve Number of the site.
4.3.2 Curve Number Method — Design Input
The volume of runoff can be estimated using the assumptions and methods described in TR-55 (SCS 1986) with two sets of data—precipitation volume and CN of the area or subareas. The distribution of rainfall in the storm is based on general geographical location.
4.3.2.1 Curve Number Method — Design Storm
The value for P is the total volume of precipitation expected in the design storm. Traditionally, the 10-year storm has been used in the design of stormwater collection systems (Veissman and Lewis 2003), with the 2-year storm often considered the “service load” storm for the site. The pervious concrete pavement system designed for active mitigation must be integrated into a system designed for the 10-year storm, including overflow structures. For new construction, this means that pipe sizes required for a 10-year storm can often be reduced with active mitigation using pervious concrete pavement systems, resulting in a cost savings. It may not be necessary to increase the capacity of existing storm sewers with additional development or retrofit applications when an active mitigation system using pervious concrete pavement is utilized.
As a general guideline, the storage capacity of an active pervious concrete pavement system is designed to accommodate most, if not all, of the site runoff of the 2-year, 24-h rainfall. The performance of the system is then checked in the 10-year, 24-h rainfall, as a minimum. Some jurisdictions require that performance in other storms must be checked as well.
The total volume of rain is clearly important; however, the effects of infiltration into the soil over time must also be considered and, therefore, the distribution of the rainfall over the 24-h period (the hydrograph) must be included in the design. The precise shape of the hydrograph is not critical, and the use of the NRCS design rainfall event is suggested unless the design professional believes another method would be more appropriate. Hourly increments are appropriate for pervious concrete pavement system design.
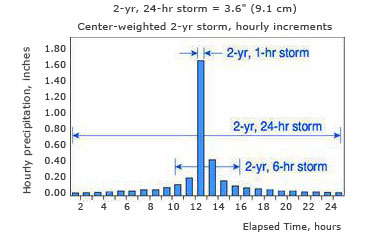
Figure 15. NRCS Type II, 2-year, 24-hour design storm hydrograph for a storm with a 4.0 in. of total rainfall. Also shown are the 2-year, 6-h storm, and the 2-year, 1-h storm.
The NRCS design storm is a center weighted, 24-h, unit rainfall event, with various rainfall intensities per hour appropriate for various regions with different types of storms. Types I and IA are consistent with rainfall patterns in the Pacific maritime climates with wet winters and dry summers; Type IA gives the least intense rainfall of all types. Type III should be used in the coastal areas of the Atlantic and Gulf of Mexico where tropical storms with large 24-h rainstorms occur. Type II storms are appropriate for most of the United States (See Figure 15). Type II storms also have the most intense, short duration rainfall segments and so can be used conservatively for Type III areas as well. See TR-55 (SCS 1986) for more information on these classifications. An important advantage of the NRCS distribution is that segments forming the 24-h pattern also comprise the design 1-h, 2-h, and 6-h storms so that the performance of the system under design can be evaluated at all of the intervals of interest by using the NRCS design storm (See Figure 14 and Malcom 2002).
The unit ordinates of the hydrograph for each time period are multiplied by the appropriate storm depth for the location of interest. This produces a design rainfall event over time that provides the total volume and distribution of intensities appropriate for that particular location. For example, if the total volume of rain in the 2-year, 24-hour storm for a location in the Type II area was 3.6 in. (91 mm), the anticipated rainfall in the first hour would be only 0.04 in. (1 mm), while the total rainfall in the 12th hour (the middle of the storm) would be 1.54 in. (39 mm), which is also the maximum hourly rate of precipitation for this storm type.
4.3.2.2 Curve Number Method — Definition and Values
The NRCS Curve Numbers (SCS 1986) are used to estimate the runoff of an area or sub-area with a given type of cover, over a given soil, for a given depth of precipitation. A higher CN means more runoff: a CN of 100 means that all rain will runoff. CN’s are no greater than 98, even for conventional pavements, since some small amount of rainfall will be held by the surface. By using coefficients (CNs) based on both soil and cover characteristics, the Curve Number method provides a more flexible and site specific method of selecting appropriate design values for estimating runoff than the use of Rational method coefficients.
The NRCS provides tables to estimate the CN of various areas with a given type of cover for soils classified, for hydrologic purposes, as Hydrologic Soil Group (HSG) A (sand, loamy sand, or sandy loam), HSG B (silt loam or loam), HSG C (sandy clay loam), or HSG D (clay loam, silty clay loam, sandy clay, silty clay, or clay), as described in Chapter 3. The soil horizon with the highest infiltration rate is HSG A; the infiltration rate is lowest for HSG D. Various charts are also available, such as that shown in Figure 6, to assist the designer in selection of an appropriate CN.
The CN for open space in good condition (more than 75% grass) in developed urban areas ranges from 39 to 80, depending on the soil type. Woods and grass cover, such as found in orchards in an agricultural area, generally have CN’s which range from 32 for cover in good condition over sandy soils with excellent drainage capacity to 86 for cover in poor condition over poorly draining soils (see Appendix A). It is clear that the characteristics of the underlying soil play an important role in the expected runoff in any particular site, with or without pervious concrete. These same soils form the subgrade under a pervious concrete pavement and, therefore, affect the rate at which rainfall captured by the pervious concrete infiltrates into the soil.
4.3.3 Curve Number Method — Design Procedure
The design procedure used with the Curve Number method is also described in CD063 (PCA 2007). In addition to design and analytical tools such as those described below, CD063 also contains typical values for the 2-year and 10-year, 24-h storms for a variety of locations, plus excerpts of documents such as TR-55 to assist in selection of an appropriate CN.
In general, the Curve Number method consists of mathematically applying the hourly distribution of rainfall for the design storm to the various surfaces of the site that discharge onto the pervious concrete pavement system. For an active mitigation system, this can include impervious surfaces such as building footprint, paved islands, and bus or truck lanes, and surfaces with natural cover such as planted traffic islands, vegetated areas on site, and adjacent properties that drain naturally onto the site under design. For a passive mitigation system, this would typically include only the surface of the pervious concrete pavement, but may also include border features associated with the pavements, such as curbs or impervious decorative borders.
The volume of rain for each hourly increment of the design storm falling on the pervious concrete and the impervious surfaces, and the excess surface runoff from adjacent areas (Q*, based on the CN of the contributing area) less the volume infiltrated into the soil, is stored (impounded) in the pervious concrete pavement system. Overland flow occurs very rapidly for small sites, so no adjustment is made for travel times for contiguous areas. This is both computationally convenient and conservative.
This process continues until the rainfall of all of the 24 hourly increments has been applied or until the storage capacity of the system has been exceeded, in which case the remaining rainfall is considered to be excess surface runoff. The procedure can be easily implemented on a spreadsheet (see Appendix B).
Infiltration maintains the effective storage capacity of the pervious concrete pavement system by removing some of the rainfall over time. The effect of infiltration on storage capacity, and therefore excess surface runoff, is a critical element in the analysis. Infiltration continues until the pervious concrete system is emptied and the storage capacity returned to its original value. The total recovery or drawdown time (the time until 100% of the storage capacity has been recovered) is also an important performance factor.
The system must be emptied and full storage capacity recovered in a reasonable amount of time. This is often the limiting factor for active mitigation applications in poorly draining soils. Recovery time is typically not a major concern in passive mitigation applications with these types of soils since the infiltration is slow and runoff relatively high even with natural cover. A recovery time of 5 days or less is reasonable for active mitigation, considering the limited probability that another significant storm will occur within 5 days. This also is common practice in water quality engineering.
In situations where recovery time is excessive, and the pervious concrete pavement system is intended to handle runoff from surfaces in addition to the pervious concrete pavement, the storm sewer system must be designed to carry essentially all of the runoff. In these cases, the pervious concrete pavement system may still provide a useful hydrological function by capturing much of the first flush.
The design professional should analyze a range of infiltration rates and design storms, conducting sensitivity analysis of performance under a variety of conditions. If the preliminary design indicates borderline performance, additional on-site investigations of infiltration may be useful. Percolation tests may not provide the needed information if conducted on the natural soil, however, and so may provide only marginal benefit. Percolation or other tests conducted on the compacted soil to be used on site should be used to confirm the general accuracy of the initial estimates when the design indicates marginal performance. As a preliminary indicator, if the site is geologically suitable for a septic system, it is probably suitable for pervious concrete pavement systems in active mitigation applications, although this guideline may be overly restrictive as a policy statement. Once verified on site, and recognizing the limits of accuracy in the design assumptions and model, a prudent designer should modify the design such that it is no longer “borderline” rather than try to improve the accuracy or precision of estimate of infiltration with additional extensive testing.
4.3.4 Curve Number Method — Output
Application of the Curve Number method to sites with pervious concrete pavement systems should provide at least two results – the total runoff from the site (in inches or mm) and the system recovery time (in days). The runoff can be converted to acre-feet or cubic feet (or cubic meters) knowing the area of the site. The excess runoff can also be converted into an equivalent CN if desired. The hourly runoff in the design storm may also be useful in some analysis.
The “equivalent CN” can be calculated for a given site based on the precipitation and the estimated volume of runoff from the site using Equations 4 and 5. For example, if 3.6 in. (91 mm) of rain fell in the 2-year, 24-h rainfall, and the pervious concrete pavement system held all but 1 in. (25 mm), which became excess runoff, the equivalent CN would be approximately 69. This value should be used with caution since the CNs developed by the NRCS were functions of the soil and cover characteristics and an “equivalent CN” calculated as just described must be a function of volume of precipitation. Since different storms will result in different values, the equivalent CN is best used for comparisons of various alternatives or to compare against the pre-development CN of the site with the same storm. The equivalent CN may also be used with additional TR-55 based analysis of downstream sites or elements, however, as discussed in 5.5.
Excess runoff is anticipated for soils with natural cover in any practical storm of interest. By impounding a significant portion of the runoff from a site, the hydrologic characteristics of a site containing a pervious concrete pavement system can, when designed to meet that specific goal, resemble those of the same site prior to development. For example, an active, grassy pasturage used for grazing livestock, in fair to good condition hydrologically, on silty soil, with a moderate infiltration rate, might have a CN of 66 prior to development. It can be shown that this same site after significant commercial development (about 30% parking area composed of pervious concrete and base course, about 15% vegetated islands, and about 55% impervious pavement and roof structure), could maintain a similar equivalent CN with a properly designed pervious concrete paving system.
4.4 The Rational Method
The “Rational Method” is commonly used to estimate the maximum runoff rate that will occur at any one time and place in small urban watersheds (those less than about 1 mi2 (about 2.5 km2)) (See Veissman and Lewis 2003, for example). This method is a simple technique, long used for estimating the maximum or peak flow (volume per unit time) anticipated from a storm that must be handled by culverts, swales, storm sewers and other “outlet” or drainage features. The Rational method estimates the maximum flow expected at some location (the outlet) rather than the total amount of runoff, and so must be used with caution in assessing the performance of retention or detention structures such as pervious concrete pavement systems. It is useful to briefly review the Rational method in more detail because it is the basis of many designs for storm drainage facilities and may be selected as the design method of choice for pervious concrete systems in some situations.
When used to analyze watershed behavior in which flat pervious concrete pavement systems overlay sands with moderate to high infiltration rates, the Rational method will often provide acceptable results. However, the Rational method may not fully capture all of the advantages of pervious concrete paving systems and can lead to problems in implementation and interpretation when used in complex situations. The Rational method should therefore be used with caution when applied to pervious concrete pavement systems. Additional discussion is provided in Section 5.8.
4.4.1 Rational Method — Design Methodology
In the Rational method, peak flow is estimated using the relationship:
Q = C/A Equation 6
where
Q is the peak run off flow (ft3/sec),
A is the area of the watershed (acres),
I is the average rainfall intensity for a critical time period (in./h), and
C is the runoff coefficient for the surface being analyzed.*
*Values for C will be different in SI units.
A higher value of C means more of the rainfall is expected to runoff the surface being analyzed; a value of “1.0” would indicate that 100% of any rain falling on that surface would run off the surface, for example. Conventional pavements are typically assigned a C of 0.98, indicating that almost all of the rain falling on that pavement would become runoff (some small amount is captured in wetting the surface and held in depression storage such as the irregularities and small “birdbaths” found on most pavements). The values of C of the individual areas are empirically based and effectively non dimensional when using customary US units. The value of C for an individual area is normally derived from tabular data, and adjusted by experience in a given location, and varies within limits, by application.
The value of C used in the equation is a composite or average value, of Cs of smaller, individual areas, weighted by area. For example, if:
45% of the total area had a C of 0.60,
15% had a C of 0.95, and
40% had a C of 0.75,
the C (composite) used in the equation would be:
0.45 (0.60) + 0.15 (0.95) + 0.40 (0.75) = 0.71
4.4.2 Rational Method — Design Input and Use
Since small urban watersheds are sensitive to short, intense rainfalls, the design storm selected is one of relatively short duration when using the Rational method. The duration of the design storm is equal to the “time of concentration” of the watershed. This is the amount of time necessary for a drop of rain to flow from the farthest point in the watershed to the outlet structure being designed. The basis for this approach is that a storm lasting the time of concentration will be the shortest (and therefore the most intense) storm which will still fully contribute to runoff at the outlet structure.
Various methods may be used to estimate the time of concentration. Kirpich's equation (Kirpich 1940) is simple and, although somewhat dated, still provides estimates with sufficient reliability to be used for designs in small watersheds. TR-55 also provides a method for estimating time of concentration, although this estimate tends to be lower (faster flow) than many others. The time of concentration for most small, urban watersheds is 15 to 30 minutes, and rarely as much as an hour.
Different, experienced designers, working independently, will almost inevitably arrive at slightly different values of peak flow. This is rarely a problem in the design of outlet structures such as culverts commonly employed in small urban areas because the pipe used in these structures are available in only a few select sizes. The selection of an appropriate value of C for a pervious concrete paving system can also be expected to vary somewhat.
Adjustments should be made in the value of C for storms with different return periods, although the value of C is the same for the 2-year and 10-year storms (Wright-McLaughlin 1969). For example, if C in the 2-year storm was 0.85 for a given site, the C used in analysis of the same site in the 50-year storm would be 1.0 (C can never exceed 1 .0). If the C in the 2-year storm was 0.50, the C used in analysis of the same site in the 50-year storm would be 0.6.
In some cases, there may be a distinction between “connected” and “disconnected” impervious areas when estimating the time of concentration. A disconnected impervious surface is one surrounded by natural ground cover and not connected directly to the drainage channel or storm sewer. The benefit of disconnected impervious areas is that the volume and velocity of discharge of the drainage channel is reduced compared to that expected when the impervious surface drains directly into the channel due to the buffer effect of natural ground cover. A much simpler analytical approach is to make no distinction between the two.
|
||||||||||
Part 5
Examples and Discussion
In this section, application of the design methods presented in Part 4 are examined and the implications of the analysis for several common situations are discussed. Broad conclusions are drawn regarding pervious concrete pavement system design needs in many situations. Some of the limitations of the Rational Method with this type of system are also examined.
Tabular results of the analysis are provided and discussed in Section 5.5. Values of both Equivalent CN and total runoff are provided. The total runoff values provide important hydrologic information and may be needed for permit applications. The total runoff value is also used to assess the often significant benefits of impoundment. Sensitivity of the solution to the values of initial estimates used in the design, which may not be known with great precision, is assessed by examining changes in the total runoff with changes in the values of initial estimates. The draw-down times of pervious concrete pavement systems in various conditions are also examined to ensure appropriate longer term performance. Comments on the findings of the analysis are also provided.
5.1 Example Proposed Development
5.1.1 Development Plan
A single development is analyzed and discussed in subsequent sections. Various site conditions are considered so that comparisons of the effects of various elements are more evident. The proposed development consists of 300,000 ft2 (about 28,000 m2 or 6.9 acres) of pervious parking, onto which the runoff from 150,000 ft2 (about 14,000 m2 or 3.5 acres) of impervious roof and impervious pavement structures drain. The impervious pavement would be used in heavy traffic-load lanes, such as delivery areas, and in turning lanes. Vegetated islands, side slopes, and contiguous undeveloped land (some of which may not belong to the owner) occupying 200,000 ft2 (about 19,000 m2, or 4.6 acres) will also drain onto the pervious concrete pavement system. The islands, slopes, and undeveloped land will be landscaped with grass and some bushes. The CN of these pervious areas and the pre-development CN will depend on the soil (HSG) used in the different examples. Modifications to this adjacent, impervious area are considered later. The site use prior to development is pasture in very good condition with continuous forage available, and minimal bare areas or trails.
Pavement depth is normally controlled by anticipated traffic loading so a minimum thickness is selected prior to the hydrologic design and analysis. Pavement depth should be specified in increments of 1 in. (25 mm). Typical pervious concrete pavement characteristics are provided in Appendix D. In the example in this chapter, a pervious concrete pavement depth of 6 in. (150 mm) will be used. The design porosity of the pervious concrete in these examples is 15%. The pervious concrete pavement system is assumed to be level.
5.1.2 Site Conditions and Constraints
Hydrologic site performance of the approximately 650,000 ft2 (about 60,000 m2 or 15 acres) development is examined for a variety of site conditions or constraints, including four different soil types and the presence or absence of a base course composed of clean stone. Performance is examined in a 2-year, 24-hr storm and 10-year, 24-hour storm.
The four different soils used in the example analysis of the site are:
1. A sandy, well draining soil classified as HSG A;
2. A loamy sand with some silt, with an intermediate infiltration rate, still classified as HSG A;
3. Another silty soil with an intermediate infiltration rate, classified as HSG B; and
4. A poorly draining silty clay, classified as HSG D.
The effects of base course are examined by using 8 in. (200 mm) of clean stone. A compacted aggregate base consisting of size #57 or #67 stone has a porosity of 40%. The levels of precipitation used in this study are relatively conservative: the precipitation in the 2-year storm is given as 4 in. (100 mm) and the precipitation in the 10-year storm is given as 6 in. (150 mm).
5.2 Pre-Development Runoff and Post-Development Runoff Without Pervious Concrete
Based on the soil classifications provided for pasturage in good condition at the time of analysis, estimates of the pre-development runoff can be determined. Runoff is estimated from the Curve Number and given in inches for 4 in. (100 mm) and 6 in. (150 mm) of precipitation (see Table 4).
|
||||||||||||||||||||||||||||||
Several comments are in order. First, although the values of runoff are reported in Table 4 to the nearest 0.01 in., such reporting precision is inappropriate given the variability in the input estimates and the uncertainty in the model itself. Second, since both Case 1 and Case 2 are in HSG A soils, the estimate of runoff is the same for both; in reality, one would expect a difference, but it is important to recognize the inherent simplifications made in this, as in all, hydrologic models. Third, the effect of the type of soil on the volume of runoff is significant and the designer should be careful to compare “apples to apples” when assessing the value of various alternatives in different areas.
Table 5A shows the pre-development CN’s and runoff values with more appropriate significant figures. Table 5B shows the post-development CN’s and runoff values anticipated from the site in the 2-year and 10-year storm without the benefit of a pervious concrete pavement system, (assuming all of the parking area has an impervious surface). Table 5B is based on composite CN’s (the area-weighted, average CN).
|
||||||||||||||||||||||||||||||
*Note: Metric conversions are not exact equivalents due to rounding in Table 4.
|
||||||||||||||||||||||||||||||
The increase in runoff associated with development is significant in the absence of some type of mitigation. Again, the effect of the underlying soil is also significant, even in the pre-development stage. As shown below, a pervious concrete pavement system appreciably improves the hydrologic performance of the site.
5.3 Preliminary Estimates for Use in the CN Method and Discussion
5.3.1 Initial Estimates of Infiltration Rate
Based on the soil classification and descriptions provided, estimates of the infiltration rates for the different soils were made based on TR-55 (SCS 1986) (see Tables 1A and 1B).
It is important to recall that these values must be estimated prior to construction and that the construction process itself will change in situ characteristics. This level of accuracy in the initial estimates of infiltration rate will provide a sufficiently robust model in most practical situations. It is best to modify marginally acceptable designs rather than depend on more accurate estimates of infiltration rates when modifying or finalizing a design, especially considering the variability
inherent in the other design elements. Preliminary designs can determine feasibility and identify necessary design modifications as early as possible. Sensitivity analysis is discussed further in section 5.6.
5.3.2 Initial Estimates of the CN of Adjacent Areas
Based on the HSG of each case and the description of cover anticipated after development, the CN of the vegetated and landscaped areas on the site that will drain into the pervious concrete pavement can be estimated. Values are similar but slightly higher (more conservative) than the pre-development case to account for foot traffic, irregular watering, slope, and other reductions in the quality of the ground cover. Estimates are drawn from TR-55 (SCS 1986).
5.4 Results and Discussion of Site Analysis Including Pervious Concrete
5.4.1 Runoff and Equivalent Curve Numbers
The runoff and equivalent CN’s for the proposed development, as affected by the soils considered in this study, are given in Tables 8A and 8B. Improvements in runoff (in inches) between pre- and post-development, where the site includes a pervious concrete paving system, are provided in Table 9.
|
||||||||||||||||||||||||
|
||||||||||||||||||
|
||||||||||||||||||||||||||||||||||||||||||||||
|
||||||||||||||||||||||||||||||||||||||||||||||
*Note: Calculated values of the equivalent Curve Number should not be given below about 36.
|
||||||||||||||||||||||||||||||||||||||||||||||
Note: A positive value indicates a positive (beneficial) improvement.
5.4.2 Discussion of Findings of Site Analysis
The pervious concrete pavement system significantly reduced post-development runoff and, in all cases where a clean stone base was used, the total runoff was actually lower than pre-development levels. This is a finding for a specific, but realistic, situation and not a generalization. This finding does, however, demonstrate the significant potential benefits of a pervious concrete pavement system.
5.4.2.1 Infiltration Effects
The analysis highlights a number of other findings. One important conclusion is that the infiltration rate of the subgrade is extremely important in terms of accurately modeling and assessing the hydrologic performance of a pervious concrete pavement system, and subgrade infiltration effects should clearly be included in the design methodology. Several other important conclusions are related to this observation.
5.4.2.1.1 System Recovery Time
The system recovery time (or “draw-down” time) of the pervious concrete pavement system at the end of the 24-h storm is acceptable for all cases except Case 4, the poorly draining soil. The draw-down time for the system in well draining soils (0.5 in./h to 1 in./h or 1.3 cm/h to 2.5 cm/h) is negligible; the draw-down time for the system in the moderately draining soil (a sandy silt) is less than 2 days. The draw-down time estimated for pervious concrete pavement alone over the poorly draining soil was almost 4 days, but was in excess of two weeks when an aggregate base was included. The extra volume of runoff captured and stored in the base required an unacceptably long time (greater than 5 days) to infiltrate and recover the capacity of the system. For this reason, the use of pervious pavements is likely to be limited in active mitigation of sites containing soils with very low infiltration rates, generally those considerably less than 0.1 in./h (0.3 cm/h). A pervious concrete pavement system could be used as a passive application for certain sites with these type of soils, however. In addition, an experienced designer might consider using a pervious pavement system in an area with infiltration rates considerably less than 0.1 in./h (0.3 cm/h) with the intention of controlling runoff rate using additional detention devices. This analysis requires detailed knowledge of storm water design and is beyond the scope of this publication.
5.4.2.1.2 Comments of Performance with Silty Soils
Some policy recommendations suggest that pervious concrete pavement systems be limited to areas with sandy soils with high infiltration rates. These policies were often adopted as interim measures prior to availability of in-depth studies. The analysis above clearly indicates that beneficial results can be attained using pervious concrete pavements in less than “ideal” soils. Although well drained sandy areas are optimal in many ways for pervious concrete applications, pervious concrete pavement systems can be used successfully in many other types of soils, including some silty soils. The analysis of the site with a soil infiltration of only 0.1 in./h (0.3 cm/h) indicates not only successful performance but shows how a developed site can, when using a properly designed pervious concrete pavement system, reduce the post-development runoff to less than that prior to development. The validity of this conclusion can be demonstrated analytically in many situations, and the analysis has been confirmed in practice (Knight 2003). There is no need to arbitrarily limit the use of pervious concrete pavement systems to sands. Another important observation is that runoff could still occur if pervious concrete were used without a clean stone base for additional storage, even in high infiltration rate sandy soils.
Infiltration characteristics of the subgrade are important for both passive and active systems. However, estimating the infiltration rate for design purposes is imprecise and the actual process of soil infiltration is complex. A simple model is acceptable for these applications and initial estimates for preliminary designs can be made with satisfactory accuracy, using conservative estimates for infiltration rates.
5.4.2.2 Equivalent Curve Number
The use of equivalent CN’s provides a way to describe the benefits of pervious concrete pavement systems in more qualitative, verbal terms, which can be useful in conveying the results of the analysis to decision makers without a strong technical background in hydrology. For example, the equivalent, post-development CN was 61 in the 10-year storm for the site with a moderate infiltration rate soil (0.1 in./h or 0.3 cm/h). In an HSG B region, this is slightly better than the CN expected in a residential area limited to 2-acre (87,000 ft2, or 8100 m2) lots with about 12% impervious surface. Another comparison is that the post-development runoff characteristics for this site would be hydrologically similar to woods, in which some grazing occurs, which are not burned, and with some forest litter covering the soil. As noted previously, it is important to compare “apples to apples” with this type of analysis.
An equivalent CN derived in this manner for a specific site can also be used for additional analysis of a larger watershed or downstream elements. The equivalent CN can be used to help estimate the peak runoff (cfs or m3/s) using the methods described in TR-55. The equivalent CN must be used with caution in these applications and estimates should be checked using alternate methods.
5.4.3 Other Design Considerations
5.4.3.1 Comments on the Use of Stone Base
While incorporation of a clean stone base reduces runoff, the reduction may be small in deep, well draining sands where the water table does not hinder infiltration. Since the use of clean stone base is usually recommended for both hydrological benefits and load carrying capability of pervious concrete pavements, additional analysis and discussion will focus on the results derived by including the base in the analysis.
The designer must consider additional factors when faced with fine grained soils. Historically, pavements have provided a level of waterproofing for the subgrade. A pervious concrete pavement system will ensure that the subgrade is saturated for a considerable period of its service life. This will reduce the subgrade modulus and, in the presence of appreciable traffic loads, can promote migration of the soil into the base course, reducing storage capacity and possibly affecting the system response to traffic. In these cases the inclusion of a filter fabric or designed sand filter is strongly recommended. The reduced modulus may affect required pavement depth; this issue is discussed in another document (Tennis, Leming, and Akers 2004).
5.4.3.2 Alternate Performance Specifications
It is reasonable to consider the minimum size of the parking lot required for various desired performance attributes. In the previous examples, the parking lot size is near that required to maintain post-development runoff at pre-development levels. If other requirements were in place, and there was a desire to optimize the use of pervious concrete pavement system, spreadsheet tools such as those found in Pervious Concrete, Hydrological Design and Resources (PCA 2006) could be used with successive approximation to find a solution.
For example, if criteria for development in the moderate infiltration area (0.1 in./h or 0.3 cm/h) were given to the effect that “…post-development runoff shall not exceed pre-development runoff by more than 25% in the 10-year storm…,” the parking lot area could be built with both impervious surface and pervious concrete pavement. Table 5A shows the pre-development runoff in this situation was estimated to be 2 in. (50 mm). Permitting total post-development runoff to be 25% higher, or 2.5 in. (64 mm), the 300,000 ft2 (about 28,000 m2) parking area could be converted into additional out-parcels (approximately 153 pervious pavement with an 8 in. (200 mm) deep stone base under the pervious concrete and 253 roof or other impervious surface) or used to offset development in an adjacent area.
5.4.3.3 Additional Impervious Surfaces
The site description used in the analysis so far included 200,000 ft2 (18,600 m2) of vegetated area. This may not be reasonable in heavily urbanized areas. If the same area were primarily paved, or very steep, or both, more runoff would clearly be expected. Converting this area into 150,000 ft2 (about 14,000 m2) of conventional paved surface and 50,000 ft2 (about 4,650 m2) of vegetated area, results in a total impervious area of 300,000 ft2 (about 28,000 m2), the same area as that occupied by the pervious concrete pavement system. Letting all of this drain into the pervious concrete pavement with 8 in. (200 mm) of clean stone base, in an area with a soil infiltration of 0.1 in./h (0.3 cm/h), would result in total runoff values of 0.8 in. (20 mm) for 4 in. (100 mm) of precipitation and 2.8 in. (71 mm) for 6 in. (150 mm) of precipitation.
Table 10 shows the comparison between the different alternatives. With almost half the site (about 46%) now impervious surface, the post-development runoff is still essentially the same (0.8 in.; 20 mm) as pre-development runoff for a large, 2-year storm, although greater (2.0 in. to 2.8 in.; 51 mm to 71 mm) for a relatively large, 10-year storm, even for a site with less than optimal soil infiltration. The pervious concrete pavement system is still providing significant hydrologic benefit. The site with a pervious concrete pavement system is providing more than 40% reduction in what the post-development runoff would be without the pervious concrete pavement system, even in this demanding situation.
An additional reduction in runoff is possible by incorporating a deeper stone base, consistent with maintaining an acceptable draw-down time. For example, using 12 in. (300 mm) of base instead of 8 in. (200 mm) would reduce the runoff back to 2.0 in. (51 mm) with 6 in. (150 mm) of precipitation, essentially the pre-development runoff. The draw-down time would be less than 3 days in this case, which is acceptable.
|
||||||||||||||||||||||||
5.4.3.4 Comments on the Use of Pervious Concrete Pavement Systems in Sandy Regions
Conducting analysis of a variety of different types of developments in sites with well drained, sandy soils, those with infiltration rates of 0.5 in./h to 1.0 in./h (1.3 cm/h to 2.5 cm/h) or greater, it is quickly apparent that the systems have excellent hydrological characteristics. In these regions, the use of more complex analysis may provide little additional benefit and it is possible to design an effective, robust, pervious concrete pavement system using little more than simple rules of thumb.
5.4.3.5 Calculations for Passive Mitigation Applications
The analysis to this point has focused on active mitigation applications of pervious concrete pavement systems. The procedure for passive applications is identical except that no runoff from adjacent surfaces is included directly in the analysis. When using the software on CD063 (PCA 2006), enter “0” for all areas except the pervious pavement.
5.4.3.6 Analysis with a High Water Table
The presence of a high water table can complicate the analysis. A simple, reasonably conservative technique used in analysis of sites overlaying sandy soils is to ignore infiltration but include the storage capacity of the sand layer (depth and effective porosity) between the water table and the bottom of the pervious concrete pavement system. More detailed analysis may require the services of a geotechnical engineer as well as a hydrologist.
5.5 Estimation of Peak Discharge
Estimates of peak discharge are needed for the design of outlet structures and may be required for permit applications. Restricting peak flow after development compared to pre-development estimates provides a relatively simple way for permit granting agencies to help assure satisfactory water quality and water quantity performance of the developed area. This approach may not fully capture all of the benefits of a pervious concrete pavement system, however. This document describes a method appropriate for hydrologic design of pervious concrete pavement systems as impoundment structures, specifically including the effects of infiltration, and is therefore based on volumetric analysis. Estimates of peak discharge, when required, may be determined with additional analysis using the results of the Curve Number approach described above.
Peak discharge may be estimated by several methods. The Rational method is discussed below in Section 5.8. TR-55 (SCS 1986) describes two methods of estimating peak discharge, the Graphical Peak Discharge Method and the Tabular Hydrograph Method. The Graphical Method can be used to estimate the peak discharge (cubic feet per second) based on time of concentration (hours), total runoff (inches), area (square miles), precipitation (inches), and CN.* The Tabular Hydrograph Method is a routing technique that requires similar input and can incorporate hydrologic behavior in multiple reaches or sub-areas.
[*Note: TR-55 provides values only in U.S. Customary units. For conversion of the final peak discharge values, 1 ft 3/s = 0.283 m3/s].
The area and precipitation information needed as input is the same as that used as input in the Curve Number method. Runoff values obtained as output of the Curve Number method can be used as input for the Graphical Peak Discharge Method. The time of concentration can be estimated using TR-55 (SCS 1986) or other means and is typically 15 to 30 minutes for most small, urban watersheds. More extensive studies often include complete hydrograph formulation and basin routing analysis. The hourly estimates of excess runoff provided by the Curve Number Method can be used as input in more complex analyses.
5.6 Comments on Designing a Robust Solution
All hydrologic models involve uncertainty and variability. The model described in this report is based on a commonly used, but synthetic storm, and requires estimates of various parameters, some of which cannot be determined with great accuracy or precision. Areas, depths and slope can be determined reasonably accurately. The CN of various surfaces must be estimated from tabular data and adjusted based on experience. The infiltration rate in service is probably the most difficult to estimate accurately. It is informative to consider the effects of variation in different input parameters on the output of the Curve Number Method with a simple sensitivity analysis.
5.6.1 Sensitivity Analysis
The conditions in Case 3 (moderate infiltration in an HSG B soil) are demanding and this case is re-examined with a variety of different initial estimates. The effects of differences in porosity of the pervious concrete, the depth of the base course, the CN of the adjacent, vegetated area, and the rate of infiltration on total runoff were determined. The original analysis used a 6 in.- (150-mm) thick pervious concrete with 15% porosity, an 8 in. (200 mm) clean stone base course with 40% porosity, a CN of 69 for the adjacent areas, and an infiltration rate of 0.1 in./h (0.3 cm/h). A total runoff of 2.0 in. (51 mm) was estimated to occur with 6 in. (150 mm) of precipitation in a NRCS Type II, 24-hour storm. The sensitivity of runoff estimates to variations in selected parameter estimates were also examined for Case 2, a site on silty sand.
The storage capacity of the pervious concrete accounts for just over 20% of the storage capacity of the total pavement system and the base course accounts for almost 80%. Slight differences in the porosity of the pervious concrete should not have a significant effect on storage capacity, so the effects of 10% porosity and 20% porosity, relatively large differences, were examined. The clean stone base course porosity should be relatively constant, but construction tolerances and sedimentation could affect the useable depth for storage, so the effects of a 1 in. (25 mm) reduction in depth were examined.
The adjacent, vegetated areas accounted for about 30% of the total area draining into the pervious concrete pavement system and the post-development CN of these areas must necessarily be estimated with some degree of uncertainty. The difference in runoff due to a CN of 61 and a CN of 79 in the Case 3 situation were examined. These values were selected as the likely range of values for the conditions and soil type given.
The default value of 0.1 in/h (0.3 cm/h) suggested in Table 2 was used in the original analysis in Case 3. The effects of variations in rate of infiltration from 0.05 in/h to 0.3 in/h (0.1 to 0.7 cm/h) were examined. This provides a reasonable range of values of a parameter which can be difficult to estimate accurately in the design phase.
Table 11 shows the runoff for Case 3 due to changing one parameter at a time. The values in the “Runoff” column are the excess runoff from the storm in inches (mm). The values in the “Difference in Runoff” column are the differences in runoff from that estimated using the original Case 3 parameter values.
|
||||||||||||||||||||||||||||||||||||||||||||||||
Note: Conversions are not exact due to differences in rounding. Values are given to reasonable and similar significant figures.
5.6.2 Discussion of Sensitivity Analysis Results
The uncertainty of hydrologic models easily exceeds several tenths of an inch (in excess of 5 mm) of runoff, but comparing differences in runoff permits observations on the effects of routine variations in characteristics or properties of important elements on performance of the system in service. One of the important observations is that relatively large variations in porosity of the pervious concrete have only a small effect on storage capacity. This implies that reasonable variations in the bulk properties of the pervious concrete during construction are acceptable. This analysis does not include effects on permeability, however, and routine maintenance is required to ensure satisfactory operation.
Likewise, a slight reduction in base course thickness will result in a slight increase in runoff. The designer should carefully consider the effects of construction tolerances and sedimentation in highly sensitive applications.
Another observation is that accuracy of initial estimates of the CN of adjacent areas is not critical. Reasonable differences in initial estimates of the adjacent area CN will result in only slight differences in the estimated runoff in most practical situations.
Variation in the estimate of the infiltration rate has a much greater effect on the estimated runoff for this site than routine variations in the other factors examined. An increase in the soil infiltration rate from 0.1 in/h to 0.3 in/h (0.3 cm/h to 0.7 cm/h) results in over a 50% improvement in capturing runoff. A reduction in the soil infiltration rate from 0.1 in/h to 0.05 in/h (0.3 cm/h to 0.1 cm/h) results in only a 25% reduction in impoundment, under the conditions given.
Sensitivity analysis of Case 2 with a 0.5 in./h (1.3 cm/h) infiltration rate and without a clean stone base leads to similar conclusions — that reasonable variations in the pervious concrete porosity, slab depth (a loss of 152 in. [13 mm]), and CN of adjacent areas have only a very slight effect, and that estimates of the infiltration rate should be accurate, but conservative. In this case, an increase in the infiltration rate to 0.8 in./h (2 cm/h) would decrease the runoff by 0.3 in. (7mm); a reduction in the infiltration rate to 0.3 in./h (0.7 cm/h) would increase the runoff by 0.4 in. (10 mm). These differences in runoff due to uncertainty in the infiltration rate are important, but may have only a marginal impact on behavior in service in many practical situations. The difference in estimated runoff is less than 10% of the precipitation.
These observations support the conclusions that it is important to properly classify the soil, that the effects of routine uncertainty in the estimate should be examined, and that the infiltration rate used in the analysis needs to be estimated conservatively when accurate estimates of the infiltration rate in service are not available. This is rarely a problem in sandy areas, but can be an issue in soils with considerable silt content.
The estimates in Table 2 based on soil type are reasonably conservative and include the positive effect of AMC assumptions. Table 2 can be used to estimate infiltration rates in preliminary and feasibility studies, or when it is difficult to obtain accurate estimates of infiltration in service. When the results of studies using these values clearly indicate acceptable performance in service, additional testing to develop more accurate estimates may not be needed.
5.6.3 Recommendations
Recognizing the limits of accuracy in the design assumptions, the uncertainty in all hydrologic models, the uncertainty in estimates of input parameters, including precipitation, and the inherent variability of construction materials, soil, and construction methods, the observations of the sensitivity analysis result in three primary recommendations:
1. Sensitivity analysis should be conducted using a reasonable range of estimates of the depth of the base course, porosity of the pervious concrete, the Curve Numbers of adjacent areas, and the infiltration rate of the soil;
2. Estimates of the infiltration rate need to be conservative — values in Table 2 are reasonable values, particularly for preliminary or feasibility studies; and
3. If the results of the basic analysis or the sensitivity study indicate a design with marginally acceptable hydrologic performance, the designer should modify the design such that it is no longer “borderline”.
This approach is generally preferable to trying to improve the accuracy or precision of the estimates with additional, extensive testing. The amount of excess storage capacity, generally obtained by providing additional depth of clean stone base course, will depend on the sensitivity of the project, regulatory requirements, and degree of uncertainty with estimates of inputs, which can vary significantly by location.
5.7 Design Factors in Cold Climates
Several additional factors must be considered in the design of pervious concrete pavement systems in areas with prolonged freezing temperatures: frost durability of the material, frost heave of the subgrade, and frost durability of saturated pervious slabs. Frost durability of the material must be ensured as with all concrete mixtures exposed to freezing temperatures. Frost heave of a saturated subgrade may cause excessive movement during long periods of freezing weather and may result in significant loss of subgrade support during spring thaws. Durability of the pervious concrete slab may be compromised if it freezes while completely saturated. This issue is linked to the draw-down time, and therefore the infiltration rate of subgrade materials at or above the frost line.
Frost durability of the material requires frost durable aggregates combined with frost durable paste. Frost durability of the paste is provided by the low water cement ratio common to pervious concrete and by using an air entraining admixture. The use of sand also improves frost durability.
5.7.1 Frost Heave
Frost heave occurs as moisture in certain soils migrates to existing ice formations resulting in the growth of ice lenses. The lenses can grow over time causing the pavement to move upward, resulting in an uneven pavement surface. The biggest problem with frost heave, however, is that the ice lens melts in the spring thaw reducing the ability of the subgrade to support load.
Frost heave is associated with fine grained soils and requires sufficient water supply. Sands and aggregates such as clean stone base are non-frost susceptible. Clearly the water supply will be adequate with a pervious concrete and frost heave must be considered in areas with susceptible subgrade soils. The techniques for mitigating potential damage associated with frost heave in pervious concrete pavement systems have not been fully established.
The techniques used with conventional pavement are to reduce the thickness of frost susceptible soil under the pavement and to increase the pavement thickness to accommodate the extra load carried by the surface course during the spring thaw. A sufficiently deep base course keeps the layer of frost susceptible soil between the bottom of the non-susceptible base and the frost line (below which no ice forms) thin enough to minimize damage. One rule-of-thumb is that the pavement system should extend to at least half of the depth of the frost line. Others recommend a more conservative approach of extending the depth to two-thirds the depth of the frost line (NRMCA). This may require a base course depth in excess of that required for storage capacity alone. The effects of ice and frozen soil on infiltration rates and draw-down time must also be considered. In areas with very deep frost penetration, alternate methods of draining the system may be required.
There are several factors which may help minimize distress associated with frost heave with many pervious concrete pavement systems, however. Minor pavement movement should cause few problems in areas of slow, relatively light traffic such as in automobile parking lots. Since a pervious concrete pavement system is designed for a saturated subgrade, the serious issue of subgrade support loss in the spring thaw may not be as critical with pervious concrete pavements as with conventional pavements.
5.7.2 Storage Capacity in Cold Climates
Determination of the required storage capacity of a pervious concrete pavement system in cold climates must include the effects of several factors. Except along the coasts, precipitation volumes are generally lower in winter months in most of North America subjected to freezing weather, but significant runoff can occur during spring thaws. The infiltration rate of frozen soil is very low, but the ground will not be frozen all winter, especially at the design frost depth. The effect of the latent heat of runoff and snowmelt on infiltration is not fully established and the effects of these factors can vary significantly with location. The storage capacity must be established, in general, such that freezing of a completely saturated pervious concrete slab will not occur. In many locations only minor adjustments to the pervious concrete pavement system may be required. When long-term freezing exposures are anticipated, such that infiltration will be essentially zero, additional methods to remove accumulated runoff may be required.
5.8 Comments on the Rational Method
The Rational method is commonly used to estimate the peak discharge of an area. The observation that runoff would occur from the site described in 5.4 if pervious concrete were used without a clean stone base even in high infiltration rate sandy soils, points one of the concerns in using the Rational method for pervious concrete pavement systems, even in well draining soils. The concerns are both technical and non-technical.
Short, intense storms, 15- to 30-minutes in duration, are typically used with the Rational method for small, urban watershed analysis. All of the rainfall from a storm of this duration could be stored in the structure, especially one which includes a clean stone base. In many situations, analysis indicates that all of the precipitation in the 2-year storm could be held in a pervious concrete pavement system as well, particularly in sandy areas with a high infiltration rate. It is tempting therefore to use a value of 0 for the rational C coefficient in the analysis, indicating that no runoff should be expected.
Using this value could be problematic in some circumstances for several reasons, however. Ignoring the antecedent rainfall effects on storage capacity could lead to a model which does not adequately estimate the actual runoff expected. It is easily possible to have a site over well draining sands that will have some runoff, even in a moderate storm, and, although peak flow will be reduced in any practical situation, the use of the Rational method fails to capture critical hydrologic features of the site. In addition, the Designer should consider the potential problems in obtaining permits for other sites when runoff has been observed or reported for a site with a “C = 0.” If a site containing a pervious concrete pavement system is designed to just hold the runoff in a 2-year storm, runoff in a 10-year storm is very likely; runoff in a 20-year storm is a virtual certainty. While a technical explanation is possible, the perception of value by all parties will likely have been compromised and subsequent developments may be forced to use less economical and less technically advantageous BMP’s.
The Rational method must be used with caution in designing pervious concrete pavement systems or in assessing the performance of these systems for technical reasons as well. The Rational method provides an estimate of peak flow rather than total runoff. Peak flow values are used in the design of outlet structures such as culverts or storm sewer pipes to ensure they can handle the largest volume occurring at any one time during the design storm, specifically including the effect of excess surface runoff traveling overland.
Since the intent of the designer is frequently to store some portion of the runoff temporarily until it can infiltrate into the underlying soil, the pervious pavement structure itself is the “outlet” and the permeability of the surface is typically well in excess of any rainfall rate during the design storm. The pervious concrete pavement system design methodology should consider the capture and infiltration of the design rainfall event as it occurs. The design professional may select the Rational method in the design of an outlet structure such as a culvert some distance downstream from the site. In these cases the pervious concrete pavement system can be analyzed separately and the value of C for the site estimated from the output of the analysis described here in Part 5. Alternately, and preferably, peak flow can be estimated using the methods of TR-55.
|
||||||||||
Estimates of the Rational method C for pervious concrete pavement systems were obtained based on back calculation from results of the Curve Number method described above and from the Graphical Peak Discharge Method in TR-55 (SCS 1986), along with separate regression analysis based on areas in the mid-Atlantic region (Malcom 2003). The values in Table 12 may be used for preliminary studies of pervious concrete pavement systems at least 6 in. (150 mm) thick in 2-year and 10-year storms. A minimum value of 0.05 is recommended. Values at the lower end of the range may be used if the pervious concrete pavement system includes a clean stone base.
WARNING: Contact with wet (unhardened) concrete, mortar, cement, or cement mixtures can cause SKIN IRRITATION, SEVERE CHEMICAL BURNS (THIRD DEGREE), or SERIOUS EYE DAMAGE. Frequent exposure may be associated with irritant and/or allergic contact dermatitis. Wear water-proof gloves, a long-sleeved shirt, full-length trousers, and proper eye protection when working with these materials. If you have to stand in wet concrete, use waterproof boots that are high enough to keep concrete from flowing into them. Wash wet concrete, mortar, cement, or cement mixtures from your skin immediately. Flush eyes with clean water immediately after contact. Indirect contact through clothing can be as serious as direct contact, so promptly rinse out wet concrete, mortar, cement, or cement mixtures from clothing. Seek immediate medical attention if you have persistent or severe discomfort.
Reference: Leming, M.L., Malcom, H.R., and Tennis, P.D., Hydrologic Design of Pervious Concrete, EB303, Portland Cement Association, Skokie, Illinois, and National Ready Mixed Concrete Association, Silver Spring, Maryland, USA, 2007, 72 pages.